
Here is an example of how to use the Grid & Chart Background Setup to place four graphs on a 2×2 divided chart.
- Create four individual graphs for the layout. Use the Download Image button in the Edit Chart toolbar to save an image of each graph on your local device. We recommend using SVG format for best quality.
- After you have completed Step 1 and saved the graph images to your local drive, start a new empty chart by clicking the Reset Chart button.
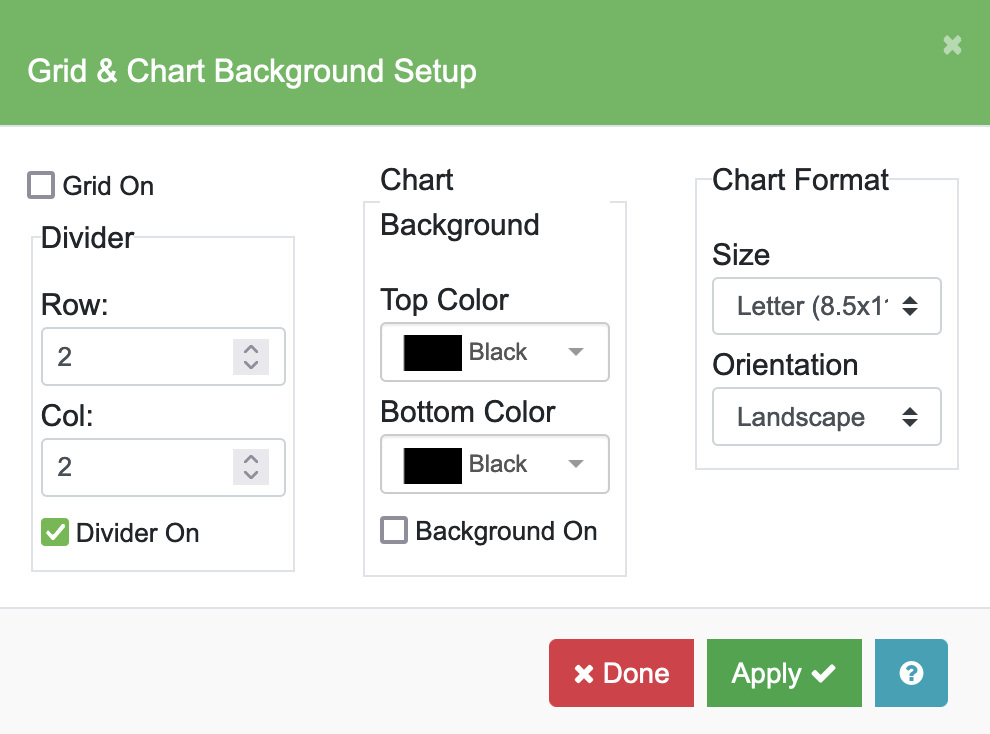
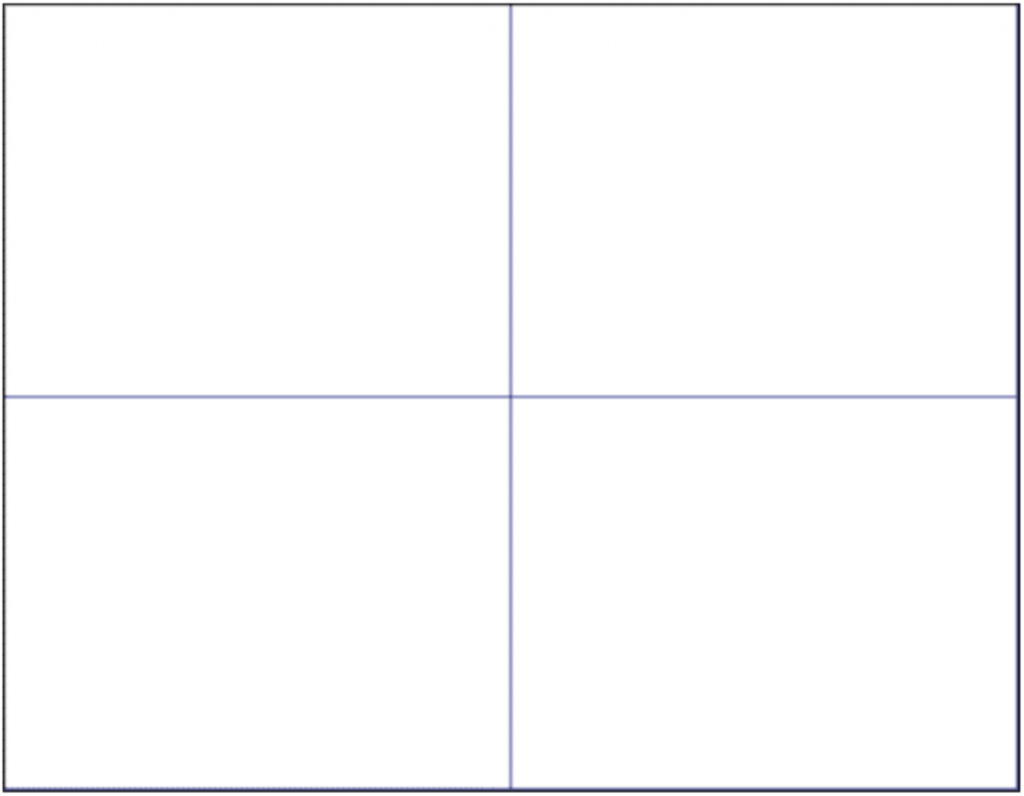
- Click on Grid & Chart Background Setup button in the Edit Chart toolbar. Enter ‘2’ in both the Row and Col fields in the Divider section and check Divider On. A 2×2 divider guide will be shown on the chart. Select “Letter” Size and “Landscape” Orientation in the Chart Format section. In this example, we assume all four individual graphs are created in Letter Size and Landscape Orientation.
- Click on the Image button in the Edit Chart toolbar. The button should turn blue and be highlighted. Move the cursor to the lower left corner for the first graph. Click, and a cross-hair cursor will appear. Hold and drag the cross-hair cursor to the upper-right corner of the first graph creating a bounding box for the image. Release the cursor and a directory folder will appear to allow you to select the image file from your local drive. Here you can use the divider guide for the size and position of the bounding box.
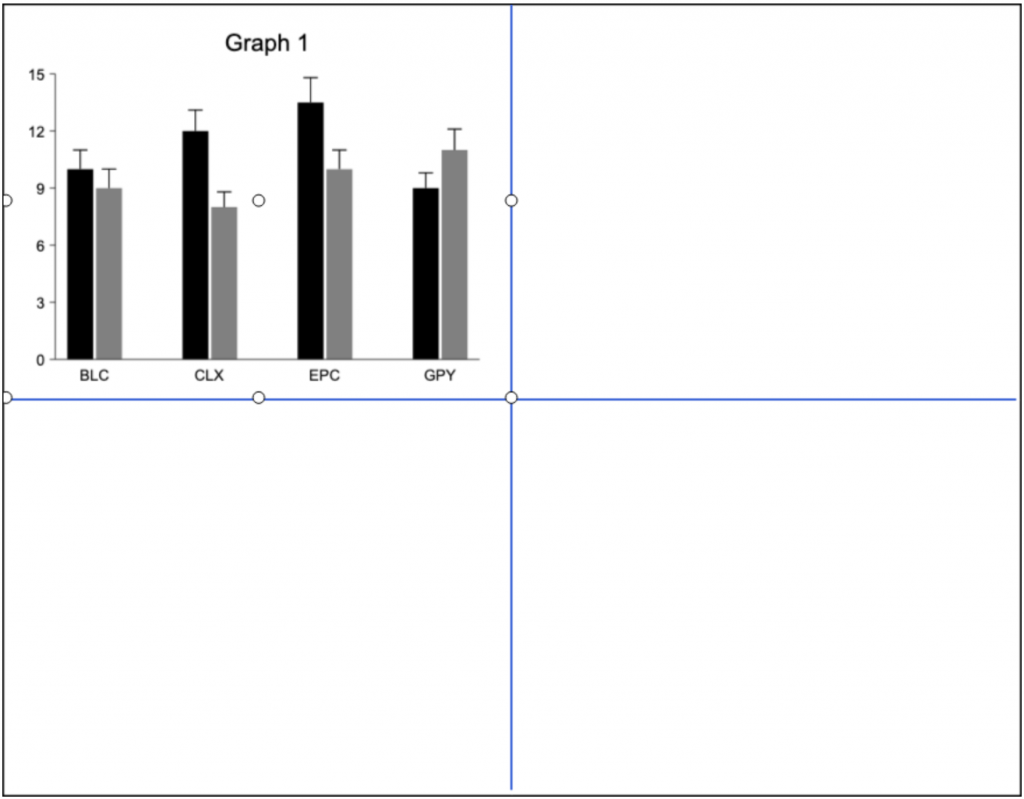
Note the “bubbles” surrounding “Graph 1” define the placement and size of the image.
- Repeat step 4 for the remaining three graph image files.

- You can customize your chart by adding drawing objects (text, boxes, arrows, circles, and images) on your chart. The chart below is annotated with text objects (A, B, C, D) to identify the four individual graph images.

Note: It is important to choose the appropriate chart format (orientation and size) when you lay out multiple graphs on a page. For example, combining two graphs on a page with landscape orientation will leave plenty of blank space around the graphs since the aspect ratios of the top and bottom graph image do not match well with the aspect ratio of the top and bottom region of the layout chart.
If you change the Chart Format to portrait orientation, the two individual graphs will fit nicely (one on top and the other below it) and with minimal blank space around the graphs. In this case, the aspect ratios for the two individual graphs are a better match for the top and bottom region of the layout chart.


See Grid & Chart Background Setup for more information about Chart Format in detail.