

Grid and Divider
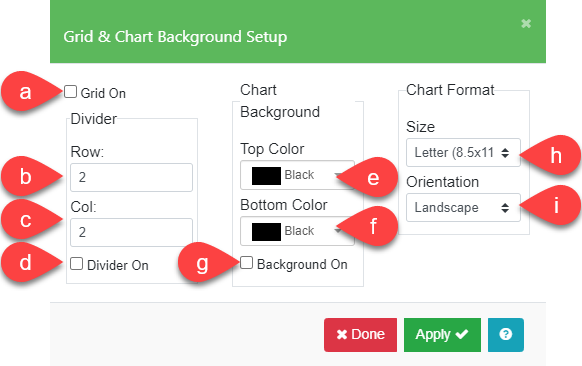
When the Grid On option (a) is checked, a grid overlay will be displayed on the chart area as a guide for placement and resizing of the chart frame, titles and axis labels, images, and drawing objects on your chart. This option is useful when you want to create a series of charts that has consistent margins and size.

The example above shows the grid overlay on the chart area. Move your cursor inside the chart frame and click to select the frame. With the grid as guidelines, use the middle “bubble” to move the frame to a new position and use the edge “bubbles” to change the size of the frame.
The Divider section is a layout guide for placing multiple images/objects on a chart. Use the Row (b) and Col (c) fields to configure the divider layout. The Row value will specify the number of rows and the Col value will specify the number of columns. Also be sure to check Divider On (d) to show the divided sections in the chart area. Below is an example of a 2 by 3 divider layout.

Example: Use the Divider section to lay out multiple graphs on a 2×2 divided chart.

- Create four individual graphs. Use the Download Image icon
 on the Edit Chart toolbar to save the image of each graph on your local device. We recommend using SVG format for best quality.
 - Enter ‘2’ in both the Row and Col fields in the Divider section of the Grid & Chart Background Setup menu and check Divider On. A 2×2 divider guide will be shown on the chart.
- Click on the Image button
 on the Edit Chart toolbar. Move the cursor to the desired location of the first graph and hold and drag the cursor to shown a bounding box. Use the divider guide for the size of the bounding box. You can then select the Image file (in this case, the image file for your first graph).
 - Repeat Step 3 for the other three graph image files.
Note: The blue divider lines shown in the example image above will not actually appear in the final chart image. They are simply placement guidelines.
Chart Background
The chart background can be either a solid color or a top-to-bottom gradient of two different colors. In the Chart Background section, choose the Top Color (e) and Bottom Color (f). If these are the same, a solid color background will be displayed. If the bottom and top colors are different, then a gradient background from one color to the other will be displayed. Be sure to check the Background On box (g). An example is given below.

Chart Format
The Size (h) and Orientation (i) fields in the Chart Format section define the chart aspect ratio and whether the chart orientation should be Landscape or Portrait.
The Size selection is used to define the aspect ratio for the chart format. The aspect ratio for the Letter size (8.5″x11″) is 0.777, the A4 size (8.25″x11.75″) is 0.702, the Slide size (2″x3″) is 0.666, and the Square size is 1.0.
The default size of the chart format is Letter (0.777 aspect ratio) with a landscape orientation.


The Size and Orientation fields determine the image size and orientation of an image file. When you download a PNG, JPEG, or PDF image file of 1000 pixels wide for a chart that has Letter size (0.777) and Landscape orientation, the width of the bitmap file will be 1000 pixels and the height 777 pixels. If the chart is in Portrait orientation, the width of the image file will be 1000 pixels and the height 1300 pixels.
When you download a SVG image file, the chart Size and Orientation fields define the shape and the aspect ratio of the chart format. The pixel values are not applicable here since SVG is a vector format file (not a bitmap).
Warning: It is possible to manually change the size and/or orientation of an existing chart, but note that objects such as titles, labels, or objects that you have set for the chart might be outside the chart area and not displayed. It is best to first determine the chart format before you enter your data and other elements.
Example: Lay out a chart with two graphs in a portrait orientation (one on top and one on bottom).

- Create the two graphs in Letter size and Landscape orientation. Download the graphs as image files in your local drive.
- Start a blank/empty chart. Enter ‘2’ in the Row field and ‘1’ in the Col field in the Divider section of the Grid & Chart Background Setup menu and then check Divider On. A 1×2 divider guide will be shown on the chart.
- Click on the Image button
 on the Edit Chart toolbar. Move the cursor to the desired location of the first graph and hold and drag the cursor to shown a bounding box. Use the divider guide for the size of the bounding box. You can then select the Image file (in this case, the image file for your first graph).
 - Repeat Step 3 for the second image file.
 on the Edit Chart toolbar. Move the cursor to the desired location of the first graph and hold and drag the cursor to shown a bounding box. Use the divider guide for the size of the bounding box. You can then select the Image file (in this case, the image file for your first graph).