
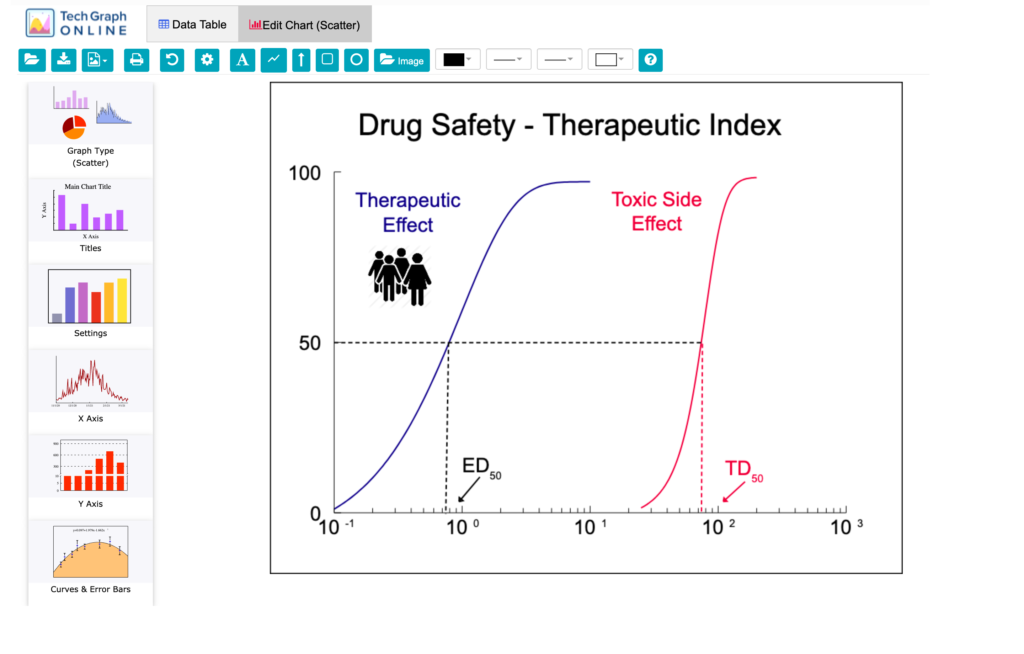
The Edit Chart tab is shown below. This is where you view and edit your graphs.
Toolbar
 Upload Chart | Uploads a chart file (.tgraph) from your local drive |
 Download Chart | Downloads the data table and chart as a .tgraph file to your local drive. |
 Download Image | Downloads the chart as a bitmap image file (PNG, JPEG, PDF, TIF) to your local drive. You can specify the width of the bitmap to up to 2400 pixels. (Refer to Grid & Chart Format on how orientation and format size changes the size and shape of your bitmap file.) Choose the SVG (Scalable Vector Graphics) image format for web publishing. SVG files are smaller yet create sharper and clearer images. Most popular browsers support this format. However, most PC applications might not fully support this format, in which case you should use a bitmap file format instead. |
 Print Chart | Prints the chart |
 Undo | Undoes the last edit. Undo only works on the single action that immediately precedes it. Undo twice in a row undoes your last undo, bringing you back to your original chart. |
 Grid & Chart Background/ Format | Show a grid and/or divider lines on the chart as a layout guide. Set the top and bottom colors for the Chart Background, and aspect ratio and orientation for the Chart Format. |
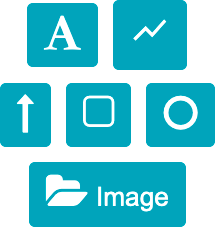 Drawing Objects | Adds objects like text, lines, arrows, boxes, circles, and images to customize your chart |
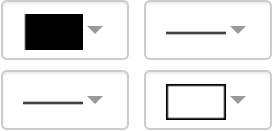 Object Styles | Choose color, line type, line width, and pattern |
 Help | Brings up the related TechGraph Online Manual article |
Sidebar
 Graph Type

Choose from a variety of graph types which include Bar, Line, Scatter, Area, Combo, Pie, Polar, Radar, and Box-Whisker.
Titles

Enter the graph titles and specify the title color, font type, size, weight, and style. You can also access special characters (such as Greek and Math symbols), superscript, and subscript.
Settings

Set the color, pattern, line style, and marker types; set frame background color; use horizontal, histogram, stacked, or overlapping bars; control bar width; print individual data values; ignore missing data; enter legend text and specify legend placement.
X Axis

Set the axis tic label format; skip labels; break the axis to omit insignificant data; adjust axis limits and number of labeled divisions; offset the tics from the end of the axis; add major and minor grid lines; choose linear, log, probability, or reverse scaling.
Y Axis

Set the axis tic label format; adjust axis limits and number of labeled divisions; offset the tics from the end of the axis; add major and minor grid lines; choose linear, log, probability, or reverse scaling; break the axis to omit insignificant data. These properties apply to both the Left and Right Y Axes.
Curves & Error Bars

Plot individual series against the left or right Y axis; plot error bars and set their format; select an automatic curve fit (linear, polynomial, exponential, log, power); plot a user-defined equation; select the style (color, line thickness, fill area, legend) for the curve fit and equation.