Get Our Technical Graphing App for Free!

TechGraphOnline™  – a Free GraphPad Prism Alternative

Graphs for Scientists and Engineers
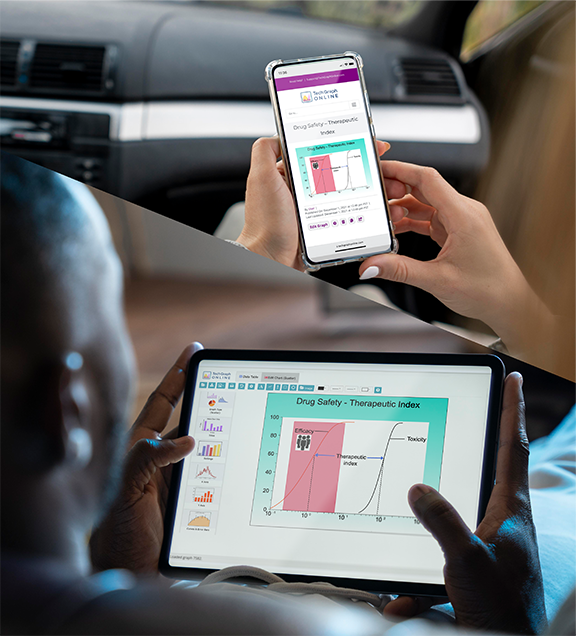
Access TechGraph Online from Anywhere

Need to create publication-quality technical graphs and charts? Don’t want to pay for a GraphPad Prism™ software license? Try TechGraphOnline, a free GraphPad Prism alternative.

  • Free – No credit card needed.
  • Online – Work from any device using your browser.
  • Cloud Storage – Easy access to your charts any time, anywhere.
  • Easy Sharing – Share any chart by link in email, chat or social media.
  • Scalable Vector Graphics (SVG) – Look great at any size on any device.
  • Template Library – Over 170 professionally prepared graph templates to get you started quickly.

Don’t take our word for it. Try our app and see for yourself. No obligations, no credit card. Sign up for FREE today!

Our Graphing App makes your data look terrific!

You work hard to collect the data for your report, publish your paper, and present to your peers. TechGraphOnline can transform your data into technical graphs that get noticed and remembered. You can count on us to create graphs that communicate your complex data in a clean, concise, and impactful way to your audience.

No more pixelated images! The TechGraph sample charts below are made in SVG (Scalable Vector Graphics) image format — ideal for web publishing, it allows scaling of the chart to any size and still creates sharp, crisp images. Charts will not have jagged lines or blurred characters. Compare your results to charts produced by our competitors; you will surely see the difference!

Get Started Quickly with Over 100 Specialized Graph Templates!

We’ve created over 100 clean, professional graph templates to make graphing your data even easier. Simple choose one and then customize it with your data and options to get the sophisticated graph you want in minutes. Each template has notes about how to create / customize this particular type of graph to help guide you.

graph
Line with “Up Only” and “Down Only” Error Bars
graph
Two Sigmodial Curves for Dose Response
graph
Gaussian Curve with Fit Statistics and 95% Confidence Interval
graph
Two Survival Curves with Censored Points as Circles
graph
Grouped Data Columns (2×3) with Error Bars

Try the TechGraphOnline Graphing App and see for yourself what it can do. No obligations, no credit card. Sign up for FREE today!

Graphing App Features

With TechGraphOnline, you can create terrific charts and graphs for technical presentations, publications, reports, images for webpages and more. Using our advanced scientific features, you can quickly create complex drawings and 2D graphs.

TechGraphOnline is so Easy to Learn and Use, it stands apart from other presentation software. Check out just some of the features that make TechGraphOnline great!

Full-Featured Graphing Capability

  • Create 2D Graphs: bar, line, scatter, area, combo, pie, histogram, box-whisker, polar, and radar

  • Input data manually, paste it from the clipboard, or import it from a CSV file

  • Copy/paste data from Excel and Google Sheets

  • X Time Series includes days, months, years, hours, minutes, and seconds

  • Use the actual X data for the X axis labels

  • Dual Y-axis plotting: plot data versus two independent Y axes

  • Linear, log, partial log, and probability scaling

  • Reverse scaling for Left Y, Right Y, and X Axis

  • Create numeric bar charts with user-defined bar width

  • Curve fit lines such as linear, exponential, and power can be selected for each data series and displayed with the associated series

  • Plot any equation of the form y=f(x) (for example, y = exp(x))

  • Automatically display curve equations with legends and control the number of decimal points for constants and coefficients

  • Fill the area under a line, curve, or equation with solid or transparent colors

  • Superscript, subscript, and add Math and Greek symbols for titles, legends, and text labels

  • Direct manipulation lets you size and position the graph legends, frames, titles, and axis labels

Created by TechGraphOnline technical graphing app
2 groups of stack bar from TechGraphOnline.com
Reverse X Axes with break and dual Y axes from TechGraphOnline.com
Exponential curve lines from TechGraphOnline.com
Grouped Bar with Up and Down Errors from TechGraphOnline.com
Lollipop chart from TechGraphOnline.com

Advanced Graphing Features:
Curve Fitting, Error Bars, and Statistics

  • Fit a complex curve to your data quickly and easily with the simple-to-use and highly automated Curve Fitter Module

  • Linear curve fitting with 100 built-in linear functions: Linear, Exponential, Power, and Polynomial

  • Nonlinear curve fitting with built-in nonlinear functions: Exponential, Power, Sigmoidal, Cumulative, Logistic Dose Response, pH Activity, 1-Site Ligand, Photosynthesis, Gaussian, Lorentzian, and Logistic Peak

  • User-defined equation to custom-fit any equation to data with up to eight user-specified coefficients

  • Find best-fit among groups of user-selected functions

  • Statistical reports available including goodness of fit, regression coefficient summary, prediction values, confidence interval, etc. Report data can be downloaded to your local drive, copied to the clipboard, or sent to the printer.

  • Save the best fit equation with the associated data series for graphing

  • Display error bars with six formats such as Up/Down, Up Only, Down Only, From Zero, Toward Zero, and Left Right

Customization Options

Easily annotate a graph with text, lines, and arrows or dynamically place and size graph images anywhere to create multiple graphs on a page, or place a scanned company logo on your chart with our drawing features.

  • Add lines, boxes, arrows, circles, text, and images

  • Change the locations of and resize graph frames and titles by clicking and dragging

  • Change the orientation (horizontal or vertical) and aspect ratio of the chart

  • Grid and divider options guide placement and sizing of graph frames, titles, and images

  • Color list with 24 colors and 3 shades per color makes a total of 72 color choices for bars and fill area under lines, curves, and equations

  • Place and size bitmap images including PNG, JPEG, TIF, and PDF. Specify the width of the image to up to 2400 pixels.

  • Supports SVG (Scalable Vector Graphics) image format. SVG is ideal for high-quality images that can be scaled to any size and make perfect images for webpage publishing.

Multiple graphs on a page from TechGraphOnline.com