This example shows how to add error bars to a graph. Plotting error data requires an additional data column which is adjacent to the primary data. For example, if the primary data is in Graph A, then the error data must be in Graph B. Error data can only be entered in Graph columns B, D, F, H, etc. So, if Graph columns A, C, and E have data, then Graph columns B, D, F must have the error value associated with the data in the previous column. Refer to the Curves and Error Bars section for more information on Error Bars. The following example has two sets of data with error bars.
- Create a new graph by clicking Graphs → Add New Graph… in TechGraph Online’s navigation bar.
- In the TechGraph Editor, click on the X Data (Label) header and choose X Data Type: “Number” and Graph Type: “Combo”.
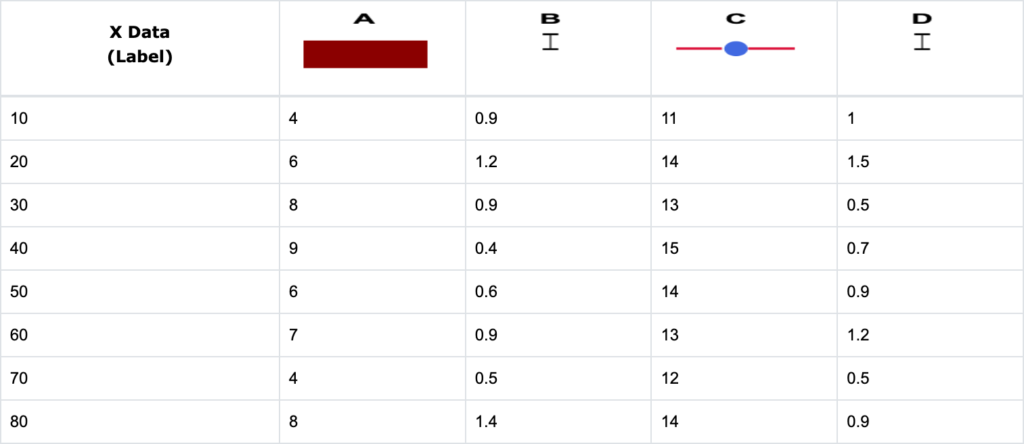
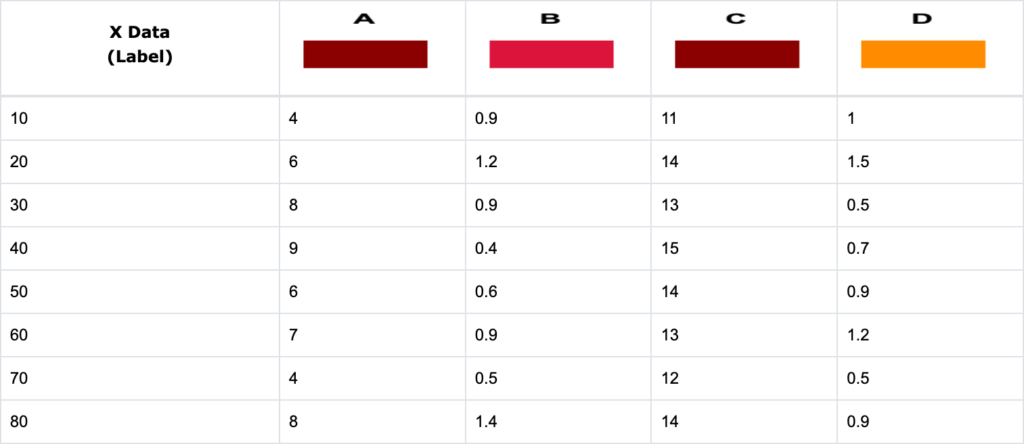
- Enter the following data into the Data Table. Data is in columns A and C while the error data is in columns B and D.
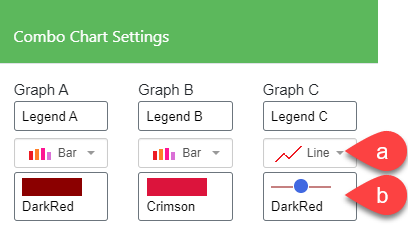
- Since a Combo Chart Type was selected, it is necessary to determine which graph type to use each data set. From the Data Table above, Graph A is shown as a Bar Graph (a) and we want Graph C to be a Line Graph with a marker. Since this is a Combo Chart, we can combine Bar and Line graphs on the same chart.
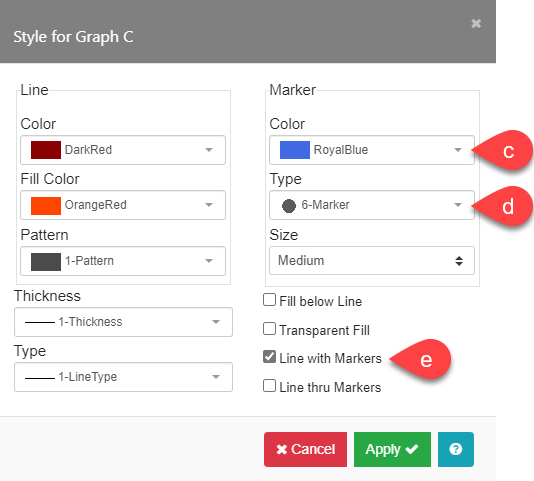
In the Edit Chart tab, go to Settings in the side menu for Graph C, click on the Graph Type field (a) and select “Line”. Then, click the Graph Style field (b) to show the Style for Graph C submenu. Change the Marker Color (c) to “RoyalBlue” and the Marker Type (d) to “6-Marker”. Check the Line with Markers box (e). Click Apply.
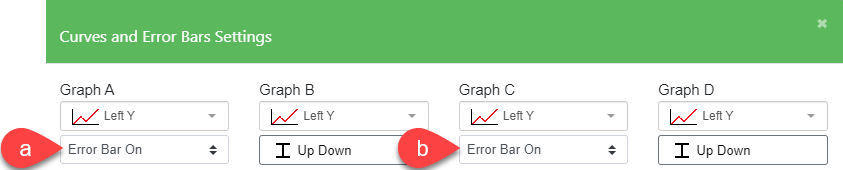
- Click the Curves & Error Bars icon in the side menu and the Curves and Error Bars menu will appear. Change the Error Bar fields for Graph A (a) and Graph C (b) to “Error Bar On”. Graphs B and D will change to “Up Down” in their Error Bar Format field.
- After clicking Apply, your chart should look like the one below after the changes you made in steps 4 (set Graph C to a Line graph with markers) and 5 (turn Error Bar On for Graphs A and C).

- If you switch back to the Data Table tab, Graphs B and D in the table below are shown as “Up Down” error values and Graph C as a line graph with markers.