
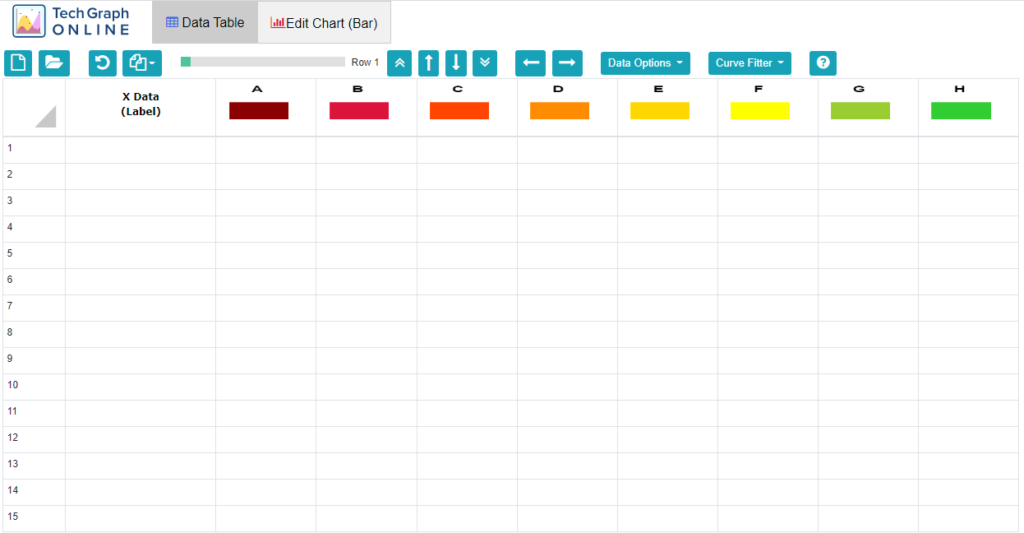
The Data Table tab is shown below. This is where you enter and edit your data. The menu buttons allow you to upload CSV (comma-separated-values) data files, edit data, navigate within the data, fill and transform data, and calculate curve fit equations.
The Data Table, where you will enter your data, holds up to 16 columns of Y data labeled as Graph A, Graph B … Graph P. Each Y data Graph Series has a maximum of 2000 data points with a chart total of 32000 data points.
 Reset Chart | Clears data and resets chart options; You must choose Graph Type and X Data Type for the new empty chart. |
 Upload CVS/Text File | Uploads data from CSV/text files store in your local device drive. |
 Undo | Undoes the last edit. Undo only works on the single action that immediately precedes it. Undo twice in a row undoes your last undo, bringing you back to your original chart. |
 Edit | Copy/Cut data, Insert/Delete data by cell or region. Data Region menu to define data cells boundaries. Shift+Arrow Keys to quickly highlight a region of cells. Graph Series Label to highlight a column of data. Select All to highlight all the data in the table. |
 Navigation | A Row Slider allows quick movement between data pages. Navigation keys to move between cells, rows, columns, and pages. |
Data Options | Options to “block” fill data or transform data by equations. |
Curve Fitter | Options to calculate and draw linear and non-linear curve fit lines for each data set |
 Help | Brings up the related TechGraph Online Manual article# |
 Data Type | Click on “(Label)” on the Data Type button to bring up the X-Axis and the graph type menu. The X data type can be either Label, Number, or Time Series. Click on the Graph Series Label (“X Data”) to highlight the data cells on the X Data column. |
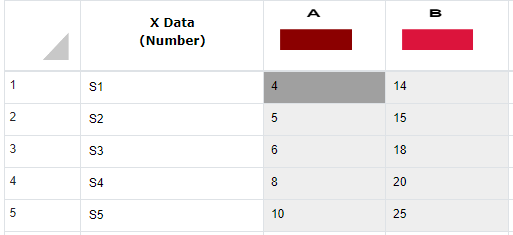
Data Series | Click on the bar pattern on the Data Series button to choose a variety of colors, patterns, line types, and marker types for each graph series. Click on the Graph Series Label (A, B, C..) to highlight the data cells on the graph series. |
Upload CSV/Text File
A CSV (comma-separated values) file uses a comma to separate data values. Each line of the file is known as a data record. A data record consists of one or more data fields separated by commas. “X1, 5, 2.3, 6, 0.5” is an example of a data record with 5 data fields separated by commas.
A Text file is similar to CSV file structure except in addition to the comma, one can also use other characters such as Tab, semicolon and space to separate data values.
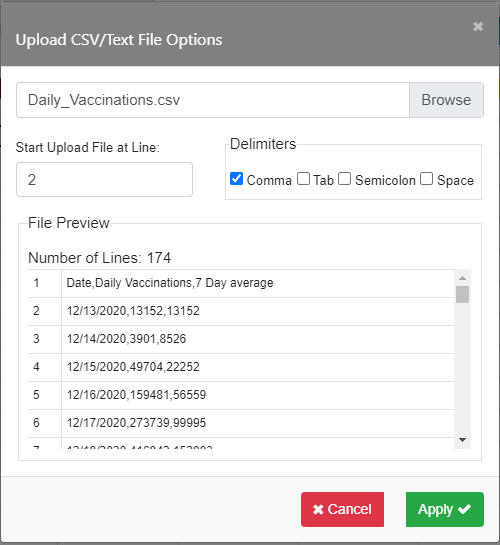
Click the Browse button to select a file with either a .csv or .txt extension. Below is an example where a CSV file named Daily_Vaccinations.csv is opened for viewing. The File Preview shows there are 174 lines of data in the file. The values in the first line: Date, Daily Vaccinations, 7 Day Average are all labels and are not compatible with the Data Table. Labels are only valid as the first entry in the data. One should skip the first line by entering ‘2’ in the Start upload File at Line: field so uploading of data will start at Line 2.
Click Apply to store the data in the Data Table as shown below. Here the Graph Type is set as ‘Combo’ and the X Data Type is ‘Time series (m/d/y)’. Graph A is set as Bar and Graph B as Line.
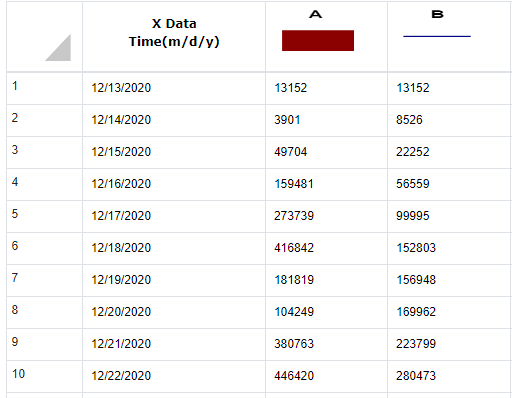
Note: The first field in the data record is saved in the X Data column, the second field in Graph A, the third field in Graph B, and so on. A maximum of 17 data fields per line are saved for each row in the Data Table.
Warning: Existing data in the table will be cleared before uploading the new data to the Data Table. However there is no change to the chart settings.
Edit
The two recommended methods to highlight sections of data to be edited are to use the Data Region feature or use Shift+Arrow Keys on your keyboard. To highlight an entire column, click on the Graph Series Label (X Data, A, B, ..P). To highlight all the data, click on the button left of the of X Label button. These features will be described below.
Clicking the Edit button brings up a dropdown menu.
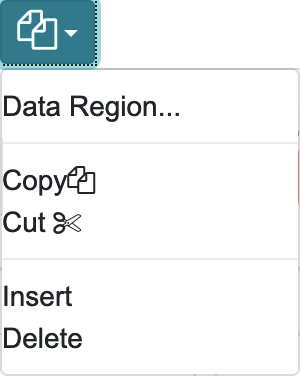
Data Region
Use the Data Region menu to highlight a large area by choosing the upper left and lower right data cell boundaries.

As an example, if you wish to highlight the first 100 rows of data stored from X Data column to Graph Series H, enter ‘X’ for Upper Left Col (a) and ‘1’ for Upper Left Row (b), as well as ‘H’ for Lower Right Col (c) and ‘100’ for Lower Right Row (d) in the Data Region menu. Click Apply and the cells defined by the Data Region will be highlighted. Click Done to exit the menu.
Shift+Arrow Keys
First click on the beginning cell of the region on data table you want to highlight. While holding down the Shift Key, use the Arrow Keys to move to neighboring rows or columns of data cells. The Left and Right keys will navigate between the series/columns. The Up and Down keys to move up and down the data rows.
Graph Series Label
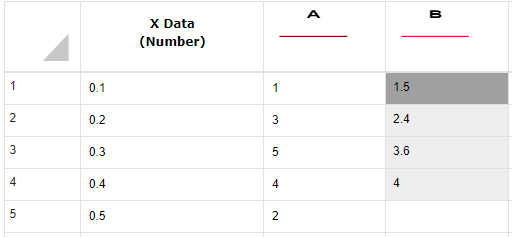
Click on the Graph Series Label (X Data, A, B, C..) buttons to highlight a column of data. For the example, click on the ‘B’ Label to highlight all the cells that have values in Column B as shown below. Holding down the Ctrl key and then clicking on the Graph Series Label will show the last page of data cells for the column.
Select All
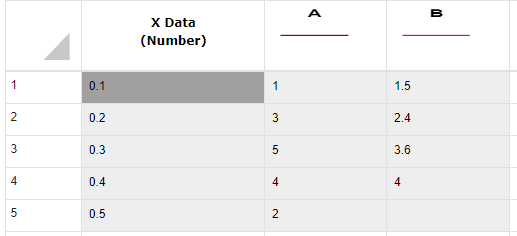
Click on the Select All ![]() button to the left of ” X Data” Label will highlight all the columns and rows of cells that contain data values. Holding down the Ctrl key (Cmd key for Mac users) and then click on the Select All button will show the last page of data cells.
button to the left of ” X Data” Label will highlight all the columns and rows of cells that contain data values. Holding down the Ctrl key (Cmd key for Mac users) and then click on the Select All button will show the last page of data cells.
Copy, Cut and Paste
Once the desired cells have been highlighted, you can use Ctrl+C for Copy or Ctrl+X for Cut. You can also Copy or Cut the data using the Edit button.
Note: Mac users should use Cmd+C for Copy and Cmd+X for Cut.
Example – Copying Data
For the example above, use the Shift+Arrow Keys, your mouse, trackpad, or touch screen to highlight the first 5 rows of data stored in Graph A and Graph B. Then use Ctrl+C (Cmd+C for Mac users) or the Copy command in the Edit menu to copy data to the clipboard. A copy message like the one below will appear to confirm your action.
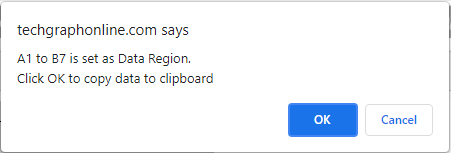
Click OK to copy the highlighted data to clipboard. To paste this data to another location on the Data Table, click the beginning cell followed by either Ctrl+V (Cmd+V for Mac users) or click on Paste using the right-mouse-button menu to paste the data. You can also paste this data to an external application like Excel/Google Sheets or Word.
Note: For a Safari Browser on an iPad with a virtual keyboard, select the cell with a stylus pen and tap on the cell until the Paste command appears above the cell. Select Paste to paste the data. For an iPad with a keyboard, you can also use Cmd+V to paste.
Notes on Paste
The data cells in Graph A to Graph P are numbers. When you paste a number like “$30,045.35”, the number value is not changed but the ‘$’ sign and comma will be removed, displaying it as “30045.35”.
When you paste a string like “Experiment A” on any of the data cells in Graph A to Graph P, you will see an empty cell because this string cannot be converted to a numeric value.
For the X Data column, you can paste any type of string like “Sample A”, “$45.34”, “Sales 2020”, “3/15/2020”, and the string will be pasted AS IS in the X Data cell. However, the X Data cell string will be interpreted either as “Label”, “Number”, or “Time Series” depending on the X Data Type that is set up for the graph. An error message will appear to warn you of an inappropriate value for a mismatched X Data Type.
Insert/Delete
Once the desired cells have been highlighted, you can Insert or Delete the data using the Edit button on the toolbar.
 Navigation
The double arrows are Previous Page/Page Up and Next Page/Page Down.
The singular up and down arrow buttons move up and down rows.
The singular left and right arrow buttons navigate between series/columns.
Data Type


Click on “(Label)” on the X Data field (a) on the Data Table to show the current settings for X Data Type and Graph Selection. This is a quick way to change the X Data Type from “Label” to “Number” (b). Click on the Graph Selection dropdown list (c) to see a list of graph types (Bar, Line, Scatter, Combo, etc.) and then select the desired type.