
The Nonlinear Curve Fit option in the Curve Fitter button menu in the Data Table toolbar will determine the best fit from your choice of 15 built-in parametric functions plus one user-defined equation. These parametric nonlinear equations are divided into four families: Standard, Waveform, Peak, and Transition. For more detail on the 15 resident parametric functions, please refer to Appendix A. You may also include the “User-Defined” selection as one of your functions. See the section on User-Defined Curve Fit.
Generate and Plot a Nonlinear Curve Fit
- Create a new graph by clicking Graphs → Add New Graph… in TechGraph Online’s navigation bar.
- In the TechGraph Editor, click on the X Data (Label) header and choose X Data Type: “Number” and Graph Type: “Scatter”.
- Enter the following data into the Data Table:
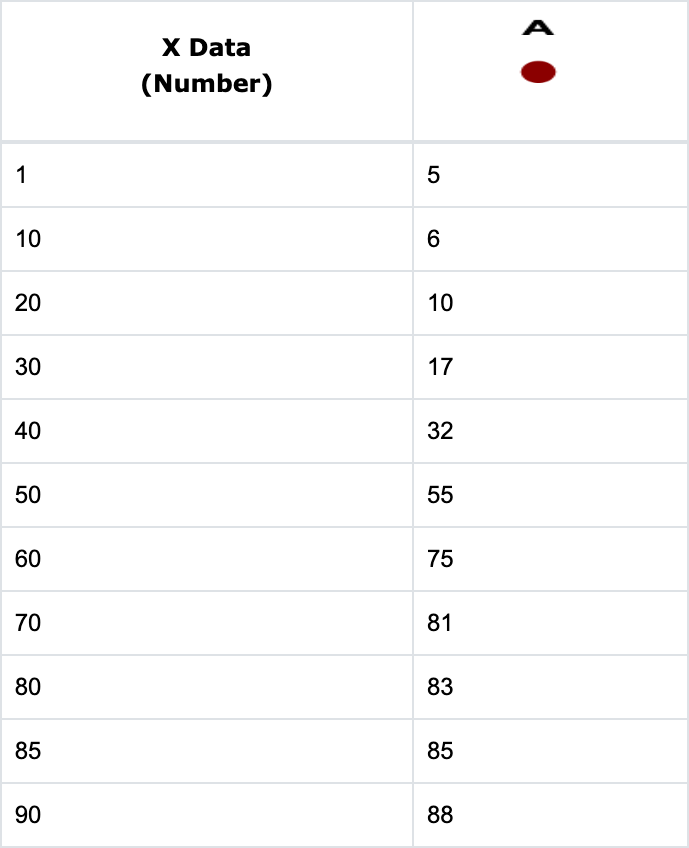
- Click the Curve Fitter button and select Nonlinear Curve Fit from the dropdown list. The Nonlinear Curve Fit menu will appear. Let’s assume that we know our data has a trend like a sigmoidal curve. Select the Sigmoidal (#9) box and then enter “X” in the X Data Col field, “A” in the Y Data Col field, “1” in Start Row, and “11” in End Row.
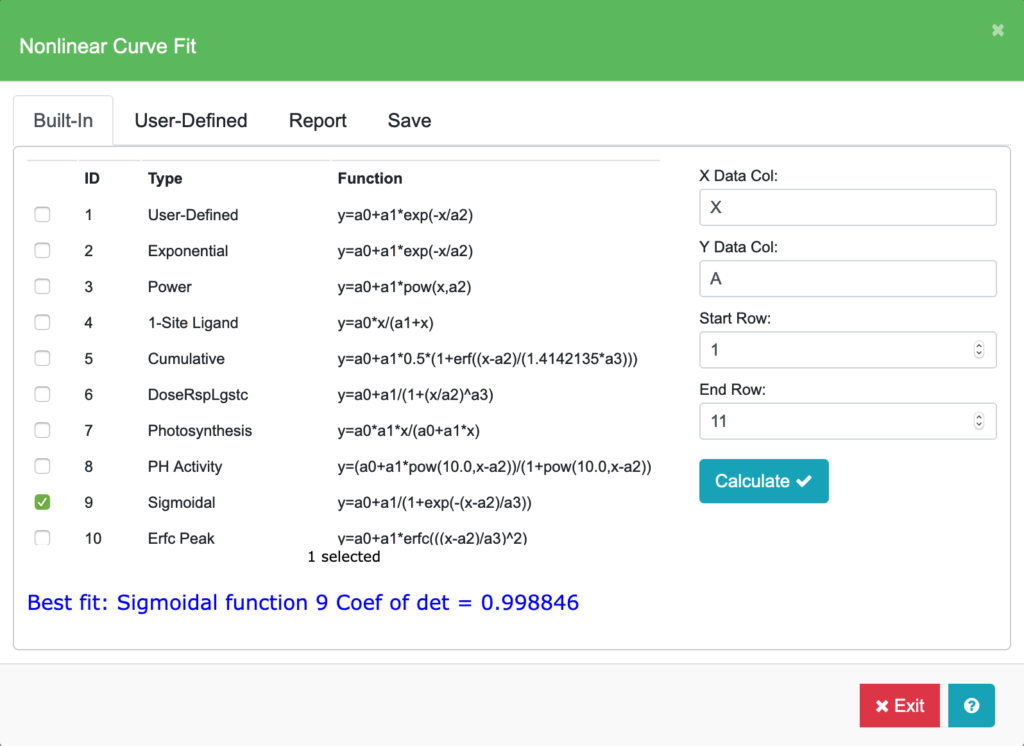
- Click Calculate. After a successful fit calculation, the Coefficient of Determination for the fitted sigmoidal equation is shown at the bottom of the menu (0.998846 in this example).
- Select the Save tab in the Nonlinear Curve Fit menu. Select “Y Predict Equation” from the Selection list. Enter “A” in the Destination Col field and click Save. A curve fit equation is generated and saved in the Graph A Equation field of the Curves and Error Bars menu.
- Switch to the Edit Chart tab and the resulting chart will be displayed with the data and the Sigmoidal equation drawn.

Note: The sigmoidal equation is initially shown in the middle of the chart. Select the equation and grab the middle bubble to move the equation to a new location on the chart.
When you edit the data values associated with the Nonlinear Curve Fit equation, you will need to redo steps 4 to 6 to get the updated coefficient values of the equation.
Refer to Tutorial 3: Linear Curve Fit Graphs for instructions on how to change the equation style (color, line thickness, fill color).