There are six Drawing Objects that can be added to annotate and customize your charts: Text, Line, Arrow, Box, Circle, and Image. You can change the color, line width, line type, and pattern of the objects using the Object Style buttons. You can also add images, like a logo, to the chart.
To add a drawing object, click the desired object button (note: the desired object button should be highlighted/color changed to blue),![]() move your cursor to the desired position, and click and hold the left mouse button to draw the appropriate bounding box that indicates the placement and size of the new object.
move your cursor to the desired position, and click and hold the left mouse button to draw the appropriate bounding box that indicates the placement and size of the new object.
To move an object, first click the object to display “bubbles” at the corners/middle of the object. The “bubble” in the middle of the object is used to move the object anywhere on the chart while the edge “bubbles” allow you to change the size of the objects.
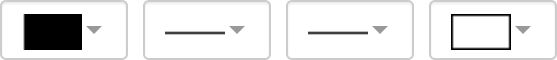
To edit or remove an object, first click the object to display “bubbles” around the object. Once the object is selected, you can use the Object Styles lists to change the color, line thickness, line type, and pattern fill that are applicable to the selected object. A Delete button will also appear on the Edit Chart toolbar. Click on the Delete button to remove the selected object.
An Edit button will also appear on the Edit Chart toolbar for a selected text object. Click on the Edit button to display the Label Settings menu where you can make changes to the text content and styles for the text object.
Note: Additionally, titles, legends, and the graph frame can be moved and edited using the same method.
Use the Grid Setup to display a guide to help with positioning and sizing when adding a draw object.
Text
Clicking the Text button will allow you to draw a text box anywhere on the chart. Once the text box is drawn, a Label Setting menu as shown below will appear. Enter text in the Label Settings field (a); use the Enter key for multiple lines of text. Special characters – European, Math, and Greek – are available in the Special Character Map (b). Subscripts and superscripts can be selected by highlighting characters and then checking the appropriate box (c). You can select the color, font, size, weight, or style of the text. These selections are “global” and will be applied to the entire text.
There are four choices for the Justify field: Left, Center, Right and Sideways. Select “Sideways” to rotate the text vertically.

Line, Arrow, Box, Circle, and Image:
A line, arrow, box, circle, and/or an image can be added anywhere on the chart. Click the object button and move the mouse cursor to the appropriate starting place on the chart. Then click, hold, and move to size and position the shape. Use the object style buttons to choose the shape color, line type, line width, and pattern.
You must click and highlight the specific object before you can edit or delete it. Once highlighted, you can also move the shape by clicking and dragging the object’s center “bubble”. You can also stretch and rotate the shape by using the “bubbles” on the edges of the object.
Note: When you add an image object, a file folder will appear that allows you to upload image files (SVG, PNG, JPEG, PDF) from your local drive. Depending on the shape and size of the bounding box, you might see empty spaces around the image as the aspect ratio of the image file is preserved during display.
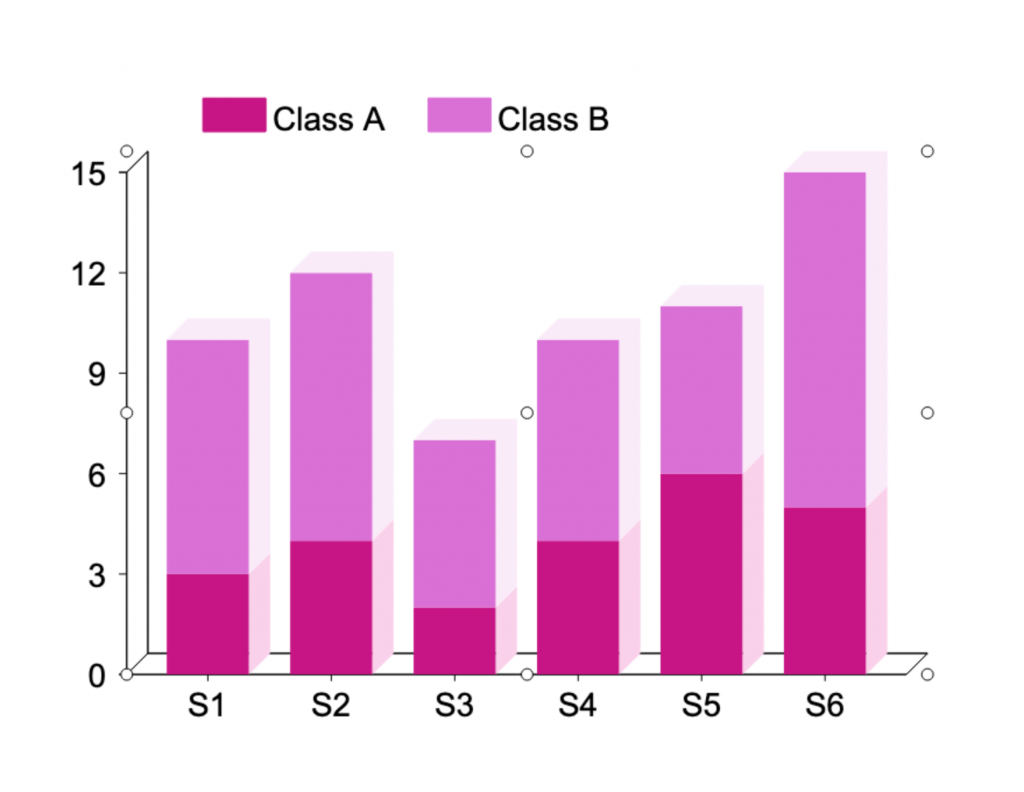
The chart below has been customized with text labels, text with subscripts, thick dashed lines, arrows, and an image.

Resize Graph and Position Legends
You can change the size and position of the graph by clicking anywhere inside the graph area to highlight the graph area. You can then grab an edge and stretch or shrink the graph or move its position. X and Y axis labels can be re-positioned as well. Shown below are the same graphs with the one on the right reduced in size.
The graph frame highlighted by “bubbles” when selected. Grab the middle bubble to move the frame and the side bubbles to shrink the frame. Resize the graph frame by clicking and dragging the edge “bubbles”.