

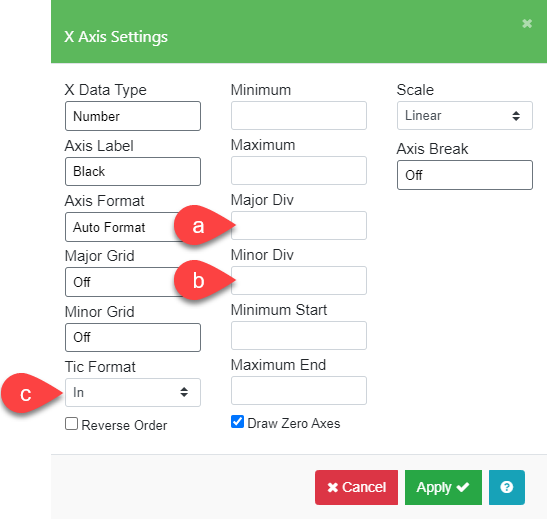
The X Axis Settings menu lets you select options for the X data for the whole graph. Most options can be selected independently for the X axes. The functions of the fields are described below.

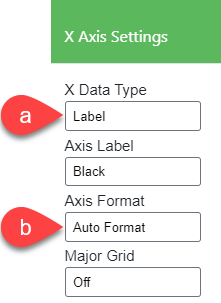
| X Data Type | Specify the X Data Type – textual labels, numbers, or time series |
| Axis Label | Specify the style for the axis tic labels |
| Axis Format | Specify the format for the axis tic labels |
| Major/Minor Grid | Add major and minor grid lines to the graph |
| Tic Format | Select the position of tic marks |
| Reverse Order | The data is displayed largest to smallest along the X axis |
| Minimum, Maximum | Adjust the axis limits |
| Major/Minor Div | Adjust the number of labeled divisions |
| Min/Max Start/End | Offset the first and last labeled tic from the end of the axis |
| Scale | Specify linear, log, or probability scaling |
| Axis Break | Break the axis to omit insignificant data |
X Data Type
Specify the X Data Type for the entire graph. There are three X Data Type Formats: Label, Number, and Time Series.
Label Data Type
X data “Label” entries can be any text or numbers. “Number” entries and “Time Series” entries are treated without regard to their value. X data is positioned equally along the X Axis.


Full Axis Line
The Full Axis Line option (b) allows you to place the axis labels at the ends of a graph (normally they are offset slightly from the ends) for Line, Scatter, Area, and Combo graphs.

Skip X Labels
This setting allows you to skip labels for data points. It is useful when there are a lot of data points making the X axis labels too crowded. The default value of 1 will place a label at each data point. A value of 2 will put a label at every other data point.


Number Data Type
“Number” (a) X Data Type entries are spaced according to their numeric value along the X Axis. Non-numeric values will cause an error.
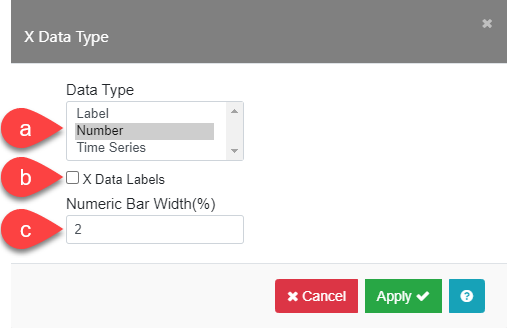
X Data Labels
The X Data Labels box (b), when checked, positions the X data on the X Axis based on numeric value, but the X labels are displayed below the data points along the X axis.


Numeric Bar Width (%)
The Numeric Bar Width (%) (c) controls the bar width for the “Number” or “Time Series” X axis. The value represents the bar width as a percentage of the total X axis length. This value can be as small as 0.1 to accommodate a large data series.

Time Series Data Type
Time Series data are positioned on the X Axis relative to their time value and the maximum value for X Axis. The valid time formats are listed below and can be chosen from the Time Series Option menu box (b).
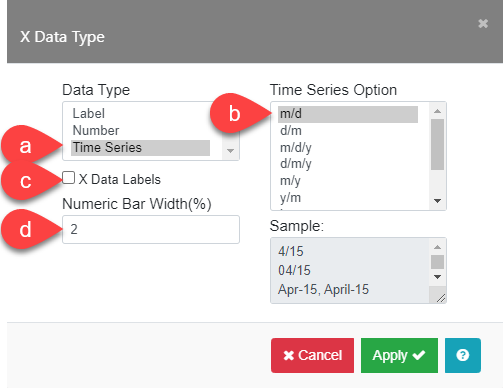
Time Series Option
The Time Series Option box shows the data formats available. All the formats listed below can be entered into the X Data column in the Data Table.
| Time Series Type | Valid Data Entry Formats |
|---|---|
| m/d | 4/15 04/15 Apr-15 April-15 |
| d/m | 15/4 15/04 15-Apr 15-April |
| m/d/y | 4/15/21 04/15/2021 4/15/2021 Apr-15-21 April 15,2021 |
| d/m/y | 15/4/21 15/04/2021 15/4/2021 15-Apr-21 15-April-21 |
| m/y | 4/21 4/2021 Apr-21 April-21 |
| y/m | 21/4 2021/4 21-Apr 21-April |
| h:mm | 10:30 10:30 PM 10:30 AM |
| h:mm:s | 10:30:20 10:30:20 PM 10:30:20 AM |
| m/d/y h:mm | 4/15/21 10:30 4/15/21 10:30 AM 4/15/21 10:30:20 PM |
Note: Please refer to X Data as Labels (c) and Numeric Bar Width (%) (d) in previous sections as the function is the same in both Number and Time Series X Data.
X Axis Label
The X Axis Label submenu (a) allows you to change the color, font, size, style, and weight of the label text.


In the Justify field (b), the position of the label along the X axis can be changed from “Center”, “Sideways”, and “Diagonal” (c) to prevent overlap for crowded data. Examples are shown below.


X-Axis Format
The Axis Format field (b) allows you to customize the format for X Axis labels. “Auto Format” is chosen by default. The options available depend on the X Data Type (a). The options for the three X Data Types: “Label”, “Number”, and “Time Series” will be shown below. Click the Axis Format field and a new menu appears. Note that “Auto Format” will be changed to “User Format” after the settings in the X Label Format menu are changed.
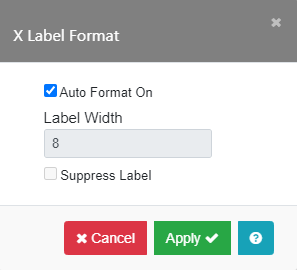
Label Axis Format:
To make changes, you must uncheck the Auto Format On box. Set the width of the text for each label by entering a number in the Label Width field. This is useful when you have many data points and want to shorten the length of each label. Enter ‘8’ in the Label Width field to display the first eight characters of each label. Check Suppress Label to hide the label.
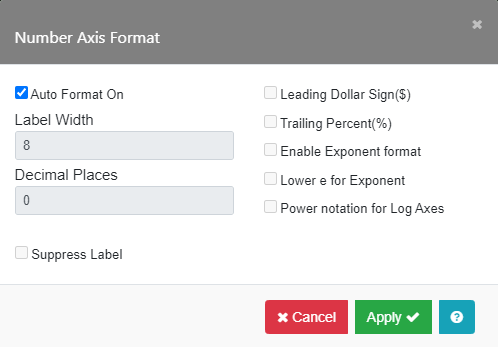
Number Axis Format:
To make changes, you must uncheck the Auto Format On box. The Number Axis Format options are Label Width, Decimal Places, add a Leading “$” or a Trailing “%”, Enable Exponent format, or Power notation for Log Axes.
Entering ‘8’ in the Label Width field and ‘2’ in the Decimal Places field will result in format labels like 0.00, 5.50, 11.0, 16.50, 22.00, …etc. To suppress the label, check the Suppress Label box.
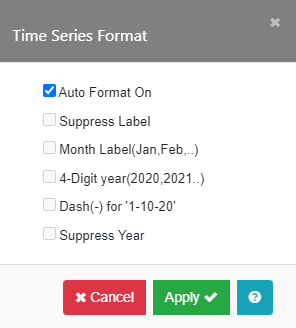
Time Series Format:
To make changes, you must uncheck the Auto Format On box. The X Axis Format options for Time Series Label are three letter dates, four digit years, and a dash or slash between date numbers. Select the options in the Time Series Format menu shown below. To suppress the label, check the Suppress Label box.
As an example, the default time series format for “m/y” is displayed as 1/20, 2/20, 3/20, etc. When the Month Label and Dash(-) options are checked, the time series will be displayed instead as Jan-20, Feb-20, Mar-20, and so on.
Minimum, Maximum, Minimum Start, Maximum End
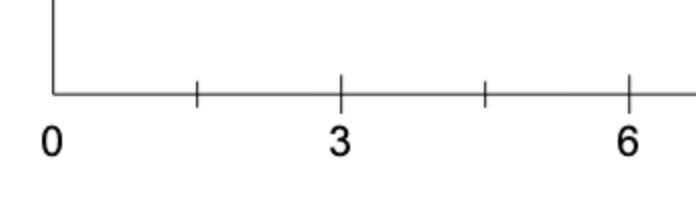
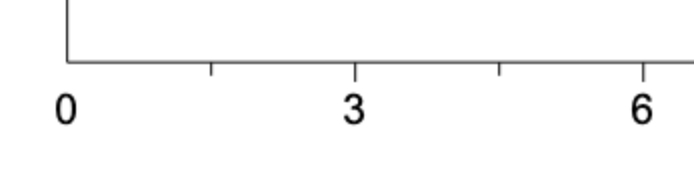
For Number or Time Series X Data, the X axis range is automatically scaled according to the X data values in the Data Table. Minimum (a) and Maximum (b) values can be set independently. If the axis is a Log Axis, the Minimum must be >0. Minimum Start (c) and Maximum End (d) can be used to offset the grid lines from the ends of the axis if values are set for Minimum and Maximum. You can enter the location of the first and last labeled tics in these fields. If they are left blank, the first and last labeled tics will be at the ends of the axis (at the Minimum and Maximum). The axis can be labeled in reverse order by checking the Reverse Order box (e). Examples are shown below.


Notes:
- Reverse Order is not available on probability axes.
- If only a Minimum or a Maximum value is entered, a suitable range will automatically be found for your graph.
- For more information on using Minimum and Maximum on log and probability axes, see the section on Scale.
Major Grid, Minor Grid
The Major Grid (a) and Minor Grid (b) Style submenus turn on the grid lines by checking the Grid On box (c) and allow you to set the thickness and type of grid lines.

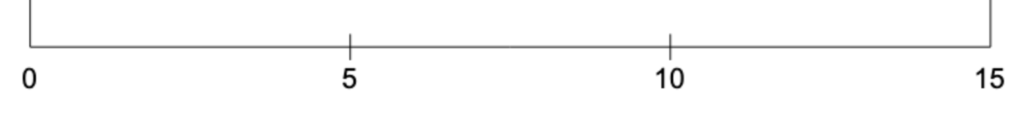
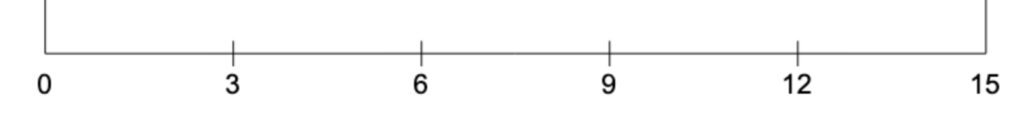
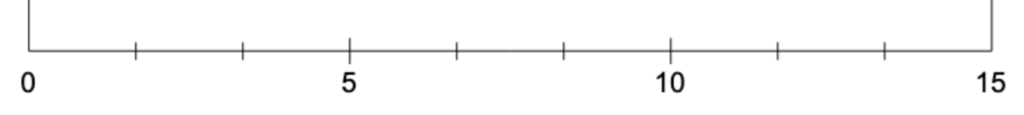
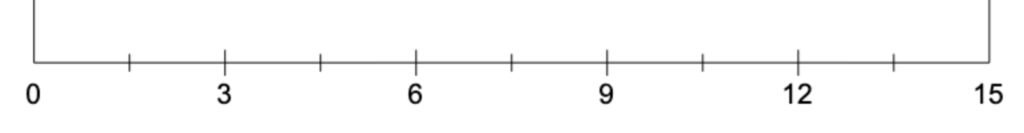
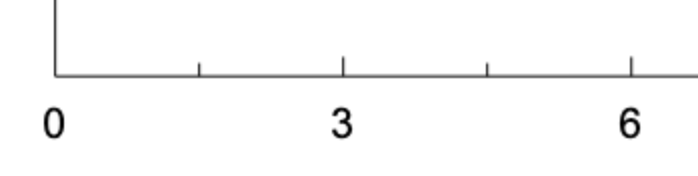
Major Div, Minor Div, Tic Format
Major Div (a) determines the number of labeled intervals along the X axis. For automatic scaling, leave this field empty and a suitable division for your graph will be determined. These settings are ignored if you have chosen the X Data Labels option for your Number X data. Minor Div (b) determines the number of minor intervals within each major division. The Tic Format field (c) allows you to decide if you want the tic marks to be above, below, or cross the X axis. If you do not wish to display any tic marks, set Tic Format to “None”.
Notes:
- The value of Major Div cannot be greater than 100.
- The value of Minor Div cannot be greater than 10.
- Minor divisions are not displayed on “3D Overlap” and “3D Effect” graphs.
- If Axis Break is selected, the Major Div or Major Unit and Minor Div or Minor Unit values are applied to only the portion of the axis before the break.
Scale
Use the Scale option to specify the type of scaling used for the axis when the X Data Type is set to “Number”.
- Linear: This is the default scale used when the X Data Type is set to “Number”. All axis format options are available for a Linear axis.
- Log: Logarithmic (log10) scaling is usually used when your data spans a wide range of values. You can display the X axes in log mode.
- Probability: Probability scaling is used when testing data for normality. A probability scale is nonlinear and represents the inverse of the Gaussian cumulative distribution function expressed as a percentage. The graph of the cumulative distribution function on a probability scale is a straight line.
X Axis Break

The Axis Break (a) options can be used with Number or Time Series X data to omit a portion of your graph that is not significant. To break the X axis, click Axis Break and the X Axis Break submenu will appear. Note that Axis Break will change from “Off” to “On” after the axis break is activated.
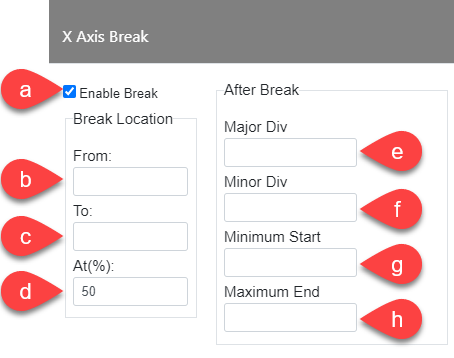
You can specify the interval (b-c) to be omitted and the position of the break along the axis, At(%) (d). To activate an axis break, check the Enable Break box (a).
Enter the values for the beginning and end of the omitted axis section in the fields From (b) and To (c). Enter the location of the break as a percentage of the total length of the axis. To break at the halfway point, enter “50” in the At (%) field (d).
Major Div (e), Minor Div (f), Minimum Start (g), and Maximum End (h) function like the options in X Axis Settings menus above. The values in the X Axis Break submenu pertain only to the section of the axis after the break.
Notes:
- You must enter values in the X Axis Settings menu: Minimum, Maximum and Major Div fields for the portion of the graph before the break.
- The break interval must be within the range between the axis Minimum and Maximum values. If either value in the Break Location section’s From or To fields is outside that range, the break will not be displayed.
X Axis Break Examples:
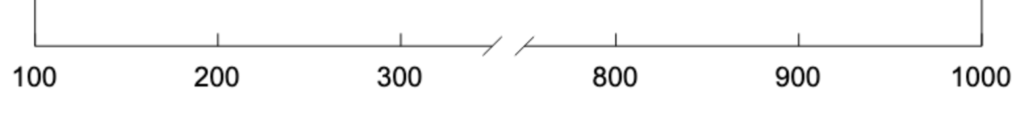
| X Axis Settings Menu | Axis Break Menu |
|---|---|
| Minimum: 100 | From: 350 |
| Maximum: 1000 | To: 750 |
| Major Div: 2 | At (%): 50% |
| Minimum Start: 100 | Major Div: 2 |
| Maximum End: 300 | Minimum Start: 800 |
| Maximum End: 1000 |
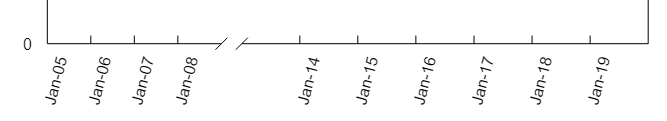
| X Axis Scaling Menu | Axis Break Menu |
|---|---|
| Minimum: 1/05 | Break from: 1/09 |
| Maximum: 1/20 | Break to: 1/13 |
| Major Unit (Year): 1 | Break at: 30% |
| Minimum Start: 1/05 | Major Unit (Year): 1 |
| Maximum End: 1/08 | Minimum Start: 1/14 |
| Maximum End: 1/20 |