When you choose “Polar” from the Graph Type icon menu, you will notice the X Axis, Y Axis, and Curves & Error Bars options are not available for Polar Plots.
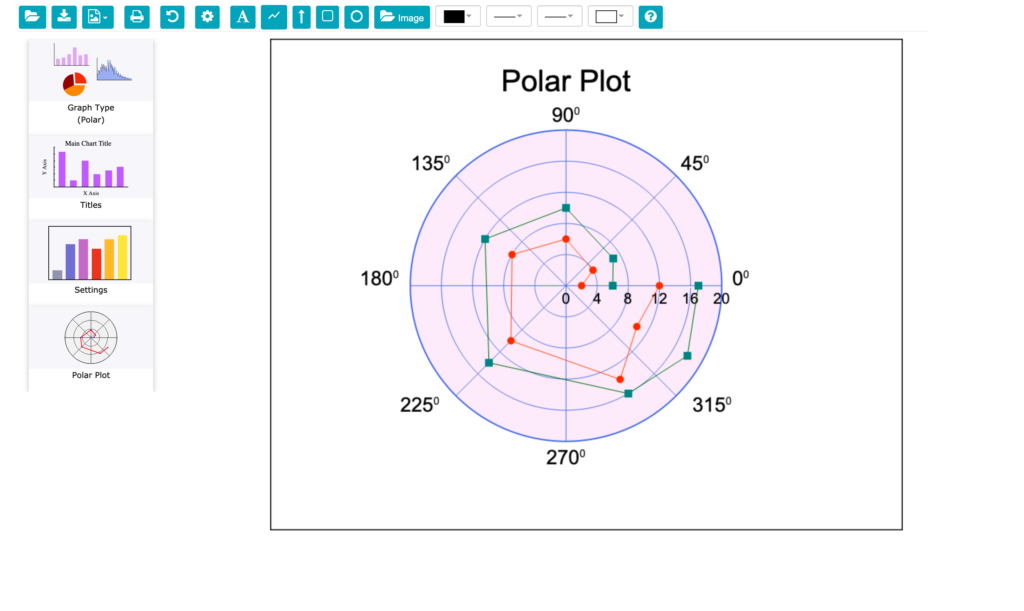
Data for a Polar Plot is entered as angle-radius (Φ,r) pairs. Enter the angle Φ in the X Data column and the corresponding radius data in Graph Series A, B, C etc. Angle measurements for polar graphs are entered in degrees. The data for the plot above is shown below.

Polar Plot Settings
When you click on the Polar Plot icon, the Polar Plot Settings menu will appear. This menu allows you to control the features particular to the Polar Plot and are divided into Angle and Radius sections as shown below.
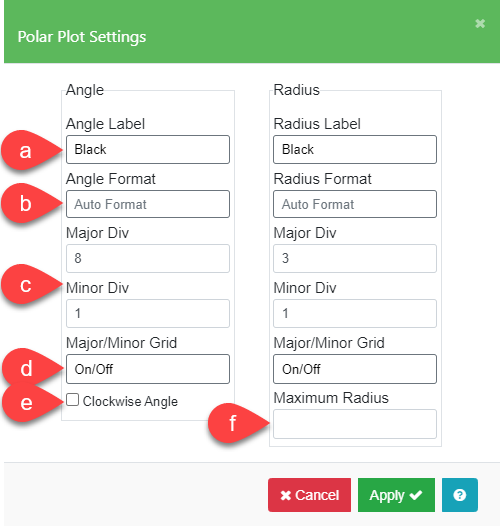
| a. Angle and Radius Label | These fields allow you to change the color, font, size, style, and weight of the text. The angle labels will be located around the plot circumference. The radius labels will be located along the zero axis horizontally from the center. |
| b. Angle and Radius Format | The format is similar to the label format described in the X-Axis Format section. |
| c. Major Div / Minor Div | You can enter the number of major and minor divisions in the angular and radial directions. The radial divisions start at the plot center and are drawn radially outward and the angular divisions are concentric circles around the plot origin. |
| d. Major / Minor Grid | You can select to turn on the divisions and also the thickness and style of the lines. Be sure to check both the Major Grid On and Minor Grid On boxes as appropriate. |
| e. Clockwise Angle | You can select the direction of the angle axis. The origin (zero degrees) is fixed at the 3-o’clock position and labels go counterclockwise by default. |
| f. Maximum Radius | You can choose the maximum value for the Radial axis. The minimum value for the Radius axis is always zero. |
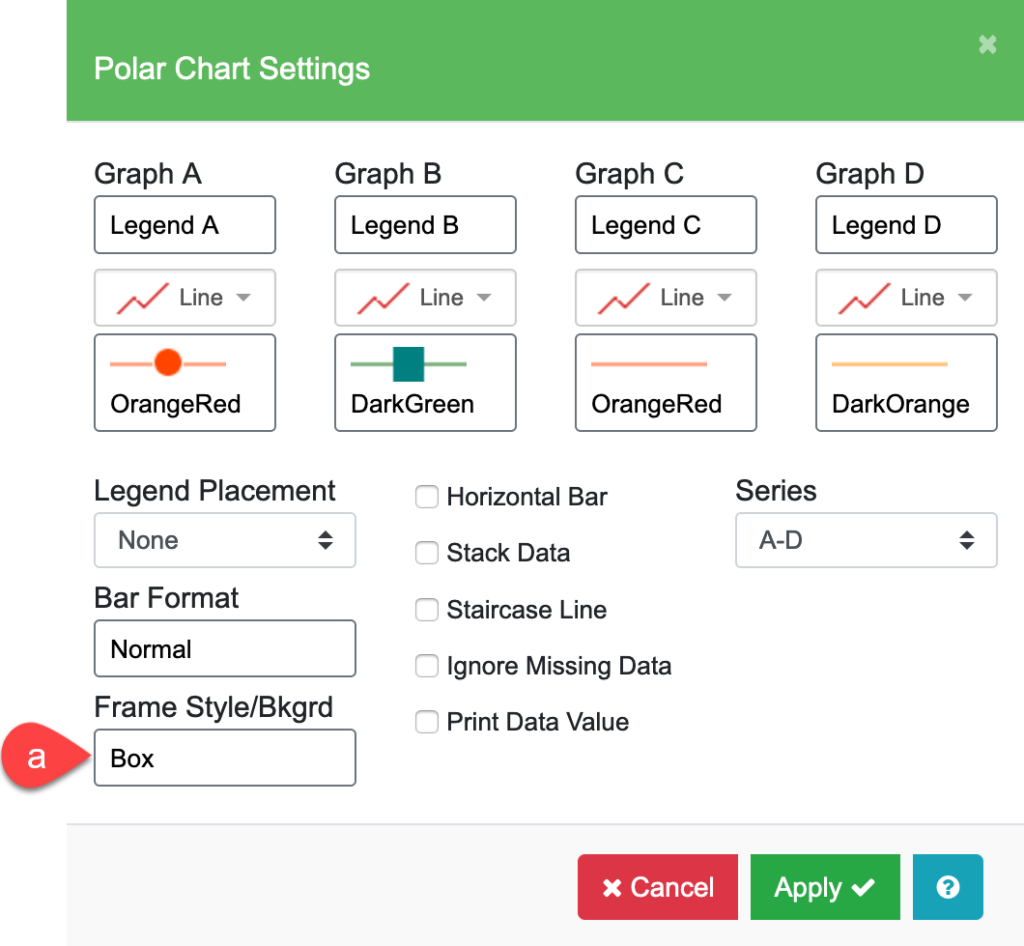
Polar Chart Settings
With the Graph Type “Polar” selected, click the Settings icon and the Polar Chart Settings menu appears as shown below. Use this to set the color and line style for each graph and to display markers as in previous Chart Settings menus.
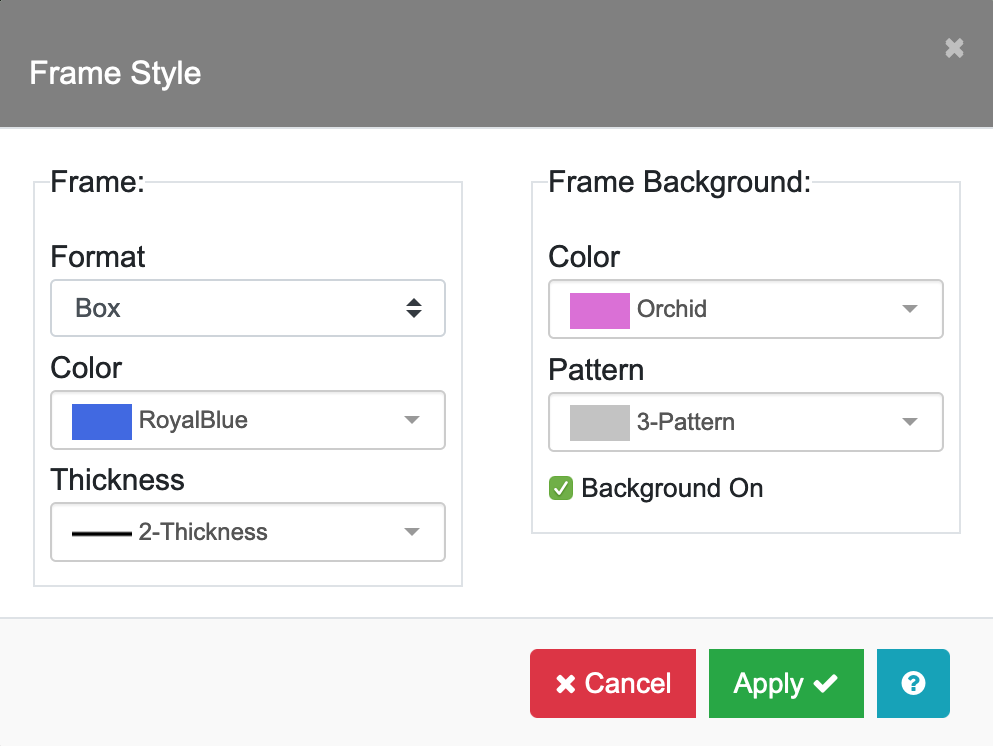
Click on the Frame Style/Background (a) field to open the Frame Style submenu which has similar features to other Frame Style menus. In the case of Polar Plots, the Frame is the angular major divisions. When you choose the Color and line Thickness for the frame, all the concentric divisions will be the same style as shown in the plot below in RoyalBlue. The Frame Background is the inside area of the plot as shown in plot below in Orchid.