

The Left Y Axis Settings menu is shown below. All Y data entered into the Data Table are numbers. The Left Y Axis is the default.
It is possible to change from the Left Y axis to the Right Y Axis by using the Axis Selection field. A separate Right Y Axis Settings menu will appear and the options can be selected independently. As an advanced feature, you can display either or both a Left and Right axis. Note, however, the Right Y axis will not be plotted unless you select Right Y Axis for one series using the Left/Right Y Axis in the Curves and Error Bars menu. Please refer to that section.
You can break either or both the Left and Right Y axes to omit a range of data.

| Axis Label | Specify the style for the axis tic labels |
| Axis Format | Specify the format for the axis tic labels |
| Major/Minor Grid | Add major and minor grid lines to the graph |
| Tic Format | Select the position of tic marks |
| Minimum, Maximum | Adjust the axis limits |
| Major/Minor Div | Adjust the number of labeled divisions |
| Min/Max Start/End | Offset the first and last labeled tic from the end of the axis |
| Scale | Specify linear, log, or probability scaling |
| Axis Break | Break the axis to omit insignificant data |
| Reverse Order | The data is displayed largest to smallest along the X axis |
| Axis Selection | Select the Left or Right side for the Y Axis |
Y Axis Label
The Y Axis Label (a) allows you to select the color, font, size, style, and weight of the label text.

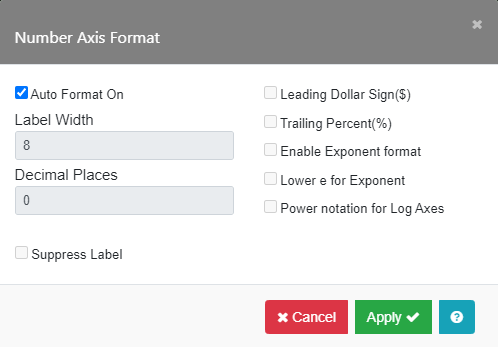
Y Axis Format
The options are set for Label Width, Decimal Places, add a Leading “$” or a Trailing “%”, Enable Exponent format, or Power notation for Log Axes. To make changes, you must uncheck the Auto Format On box.
Entering ‘8’ in the Label Width field and ‘2’ in the Decimal Places field will result in format labels like 0.00, 5.50, 11.0, 16.50, 22.00, …etc. To suppress the label, check the Suppress Label box.
Major Grid, Minor Grid
The Major Grid (a) and Minor Grid (b) options turn on the grid lines. Checking the Grid On box (c) allows you to set the thickness and type of grid lines.

Tic Format and Axis Selection
Tic Format (a) specifies whether the tics are inside and/or outside the axis frame. If you do not wish to display any tic marks, set Tic Format to “None”. Axis Selection (b) specifies on which axes the tics will occur. There is a checkbox for each axis.

Note: Tics are always drawn when Graph Style is set to “3D Effect” or “3D Overlap”. The tic thickness is determined by the line thickness chosen in the Major Grid and Minor Grid submenus.
Minimum, Maximum, Minimum Start, Maximum End, Reverse Order
The Y axis range is automatically scaled according to the Y data values in the Data Table for each Y axis. Minimum (a) and Maximum (b) values can be set independently. If the axis is a Log Axis, the Minimum must be >0. Minimum Start (c) and Maximum End (d) can be used to offset the grid lines from the ends of the axis if values are set for Minimum and Maximum. You can enter the location of the first and last labeled tics in these fields. If they are left blank, the first and last labeled tics will be at the ends of the axis (at the Minimum and Maximum). The axis can be labeled in reverse order by checking the Reverse Order box (e). Examples are shown below.

Notes:
- Some Min/Max values can cause some data to be omitted from the graph.
- If one or both of the axis Min/Max values is empty, a suitable range value for your graph will automatically be displayed.
- Reverse axis scaling is not supported if the Graph Style is set to “3D Effect” or “3D Overlap”, or if Scale is set to “Probability”.
- See the section on Scale for hints on using Minimum and Maximum on log and probability axes.


Major Div, Minor Div
Major Div determines the number of labeled intervals along the axis. For automatic scaling, leave the fields empty and a suitable division for your graph will be applied. Minor Div determines the number of minor intervals for each major division.
Notes:
- The value of Major Div cannot be greater than 100.
- The value of Minor Div cannot be greater than 10.
- No minor divisions are displayed on graphs in “3D Effect” or “3D Overlap” Style.
- If Axis Break is selected on the Y axis, the Major Div and Minor Div options apply only to the segment of the axis before the break.
- See the section on Scale for hints on using Major Div and Minor Div on log and probability axes.

Max = 15,
Major Div = 5,
Minor Div = 2

Scale
Use the Scale option to specify the type of scaling used for the Left and Right Y Axis.
- Linear: This is the default scale used for Y Axis.
- Log: Logarithmic (log10) scaling is usually used when your data spans a wide range of values. You can display the Y axes in log mode.
- Probability: Probability scaling is used when testing data for normality. A probability scale is nonlinear and represents the inverse of the Gaussian cumulative distribution function expressed as a percentage. The graph of the cumulative distribution function on a probability scale is a straight line.
Hints – Log Axis:
- Negative and zero data values are ignored when Scale is set to “Logarithmic”.
- Minimum and Maximum values for your axis are usually entered as integer powers of 10 (for example, 1, 10, 100, etc.) which plot complete log cycles.
- Scaling to partial log cycles is allowed. Enter minimum and maximum values that are not integer powers of 10 (for example 2, 30, 400, etc.). The axis will begin or end at the first (unlabeled) minor tic above the value you enter.
- To display major and minor tic labels, set Minor Div to 1.
- The Minimum Start and Maximum End fields are ignored.
- You can check the Power Notation for Log Axes option in the Axis Format field to display axis labels in the form 1010 instead of 1e+10. See Y Axis Format.

Hints – Probability Axis:
- When using a Probability scale, you must enter your data as percentiles.
- Negative and zero data values are ignored when Scale is set to “Probability”.
- Minimum and Maximum values are rounded up to the next major division of the probability scale.
- The major and minor divisions, start and end divisions, and axis break options are ignored for Probability scaling.
- If your data is normalized to 1 (i.e. in the range 0.001 to 0.999), use the Data Options → Transform function in to multiply your data by a factor of 100.
Y Axis Break
Axis Break (a) can be used to omit any portion of your graph. To break the Y Axis in either the Left or Right Y Axis Settings menu, select the Axis Break field. The Left/Right Y Axis Break submenu will appear, where you can specify the interval (b-c) to be omitted, and the position of the break along the axis At(Percent) (d). To enable the break, check the Enable Break box. You can break both the left and the right Y axes.

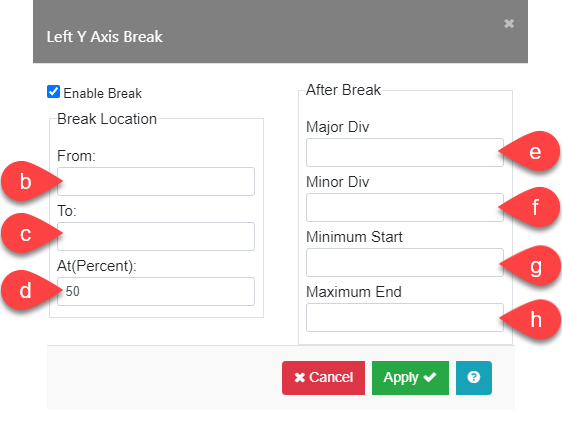
Enter the values for the beginning and end of the omitted axis section in the fields From (b) and To (c). Enter the location of the break as a percentage of the total length of the axis. To break at the halfway point, enter “50” in the At (Percent) field (d).
Major Div (e), Minor Div (f), Minimum Start (g), and Maximum End (h) function like the options in Y Axis Settings menus above. The values in the Axis Break menu pertain only to the section of the axis after the break.
Notes:
- You must enter values in the Y Axis Settings menu: Minimum, Maximum, and Major Div fields for the portion of the graph before the Break.
- The break interval must be within the range between the axis Minimum and Maximum values. If either value in the Break Location section’s From or To fields is outside that range, the break will not be displayed.
- Y Axis breaks are not supported on Area graphs, when the “3D Overlap” or “3D Effect” Graph Style is selected, or for horizontal bar graphs.
Y Axis Break Examples:


| Settings Menu | Break Menu |
|---|---|
| Minimum: 0 | Break From: 100 |
| Maximum: 1000 | Break To: 300 |
| Major Div: 2 | Break At (%): 50% |
| Minimum Start: 0 | Major Div: 6 |
| Maximum End: 100 | Minimum Start: 400 |
| Maximum End: 1000 |