
Welcome to TechGraph Online. Now that you have created a new account, let’s get started on making your first graph!
After registering your user account and password, the following Getting Started screen will appear.
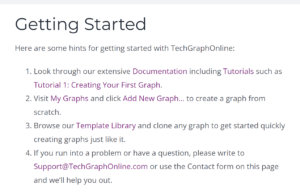
This tutorial will show how to create a new graph from the beginning, entering data, choosing graph settings, and then saving the graph in your personal library.
Getting Started Video
Creating Your First Graph
- Click on Graphs → Add New Graph… on the website’s main navigation bar to go to an “Empty Graph” page.
- Click on Edit Graph
 to activate TechGraph Editor. As the window prepares to load onto the screen, the button will change appearance to have a loading wheel and say “Loading…”.
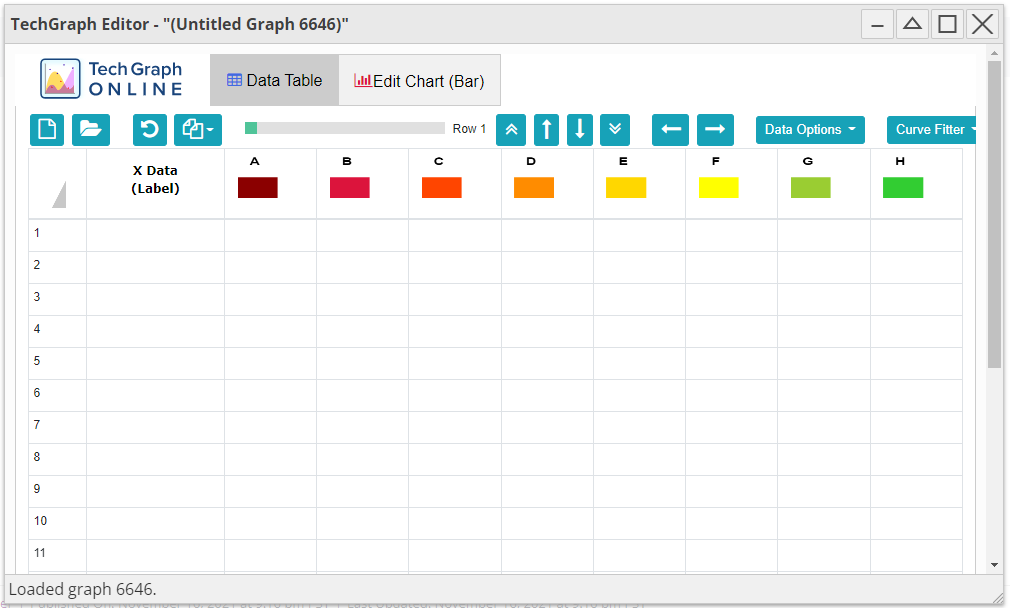
- A blank Data Table window for the TechGraph Editor will appear on the screen. Click on the Maximize
 icon on the TechGraph Editor toolbar to maximize the window.
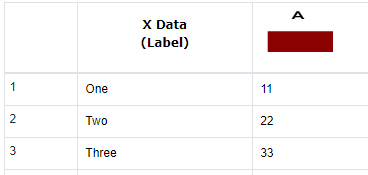
- Next, enter the following data in X Data and Graph A column.
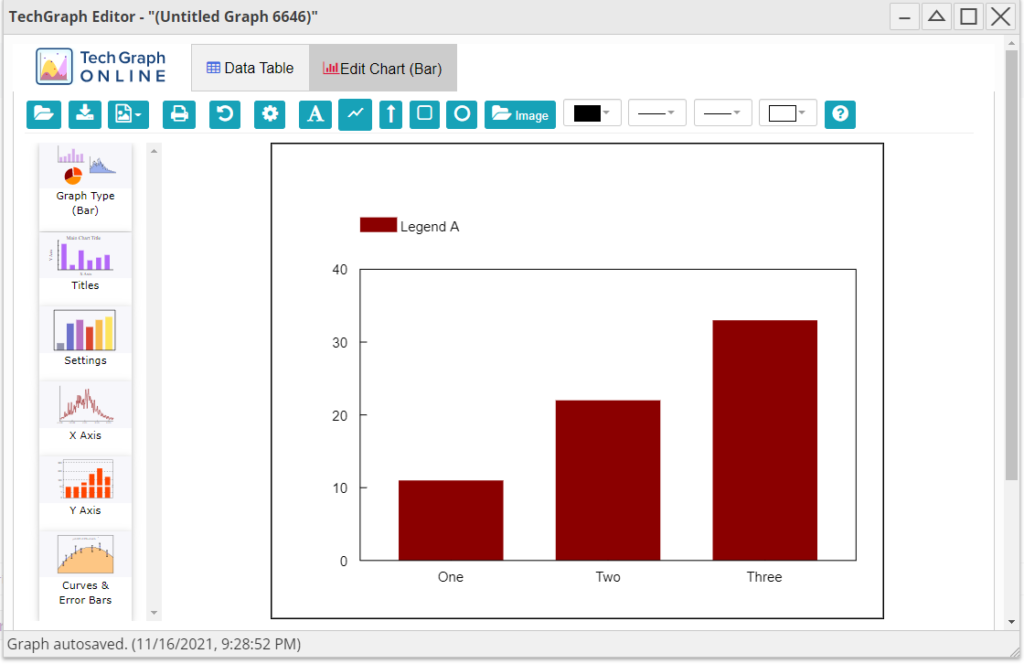
- Click on the Edit Chart tab and the following screen will appear.
- Next, click on the Titles sidebar icon to open a Title Settings dialog box.
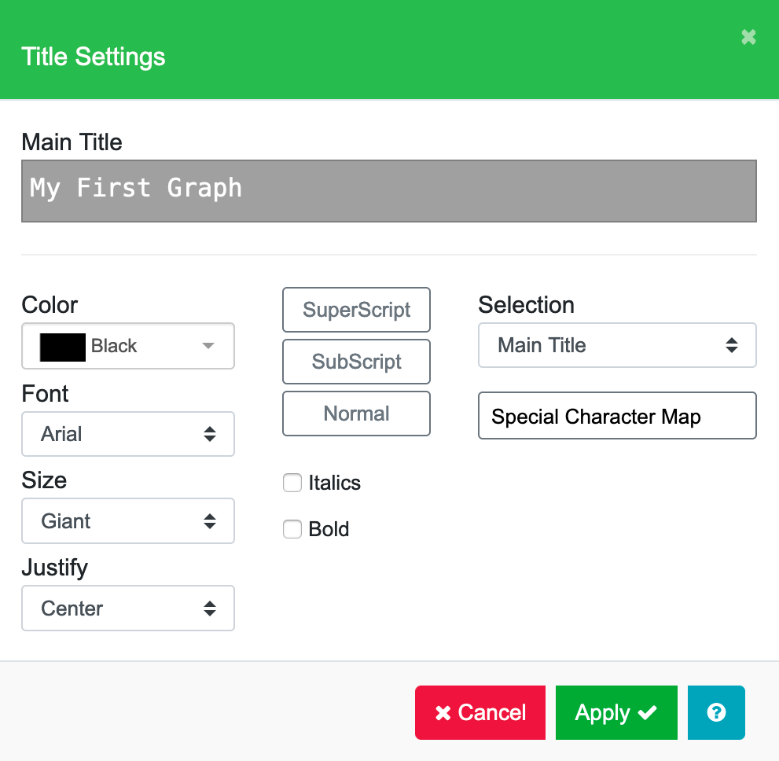
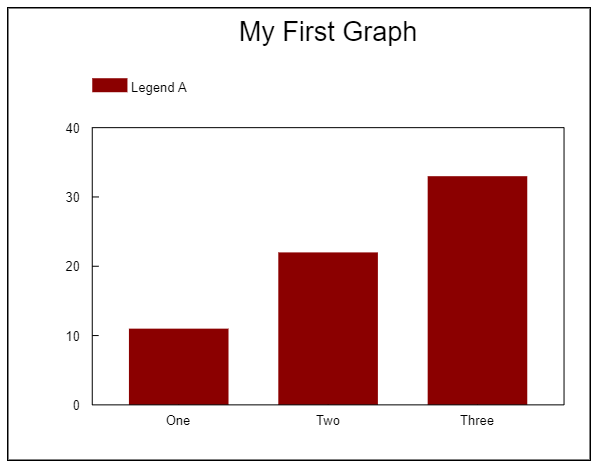
In the Main Title field, enter a title (e.g. “My First Graph”) and then click Apply. The title will appear on the graph.
Optional
Use the Drawing Objects ![]() on the Edit Chart toolbar to annotate and customize your charts with Text, Line, Arrow, Box , Circle and Image.
on the Edit Chart toolbar to annotate and customize your charts with Text, Line, Arrow, Box , Circle and Image.
Click on the Print Chart ![]() button to print your chart.
button to print your chart.
Click on the Download Image ![]() button to save a bitmap image file such as PNG, JPEG and PDF on your local drive for reports and presentations or a SVG graphics file for web publishing.
button to save a bitmap image file such as PNG, JPEG and PDF on your local drive for reports and presentations or a SVG graphics file for web publishing.
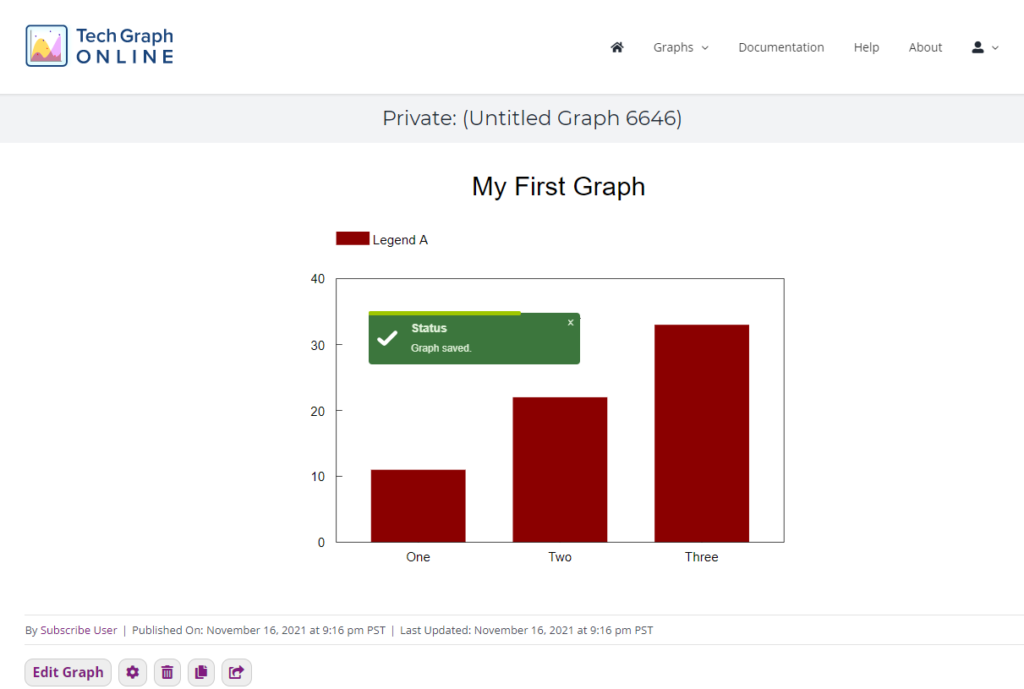
- Click on the Close and Save
 button on the right corner of Graphics Editor toolbar to return to the “Empty Graph” page (as shown in Step 1). A popup will appear to ask if you wish to save graph. Click OK and the graph that you create in the TechGraph Editor will replace the empty graph.
A small green Status box should appear shortly after closing the TechGraph Editor window with a progress bar ensuring that your data was saved.
- Go to Graphs → My Graphs to see your personalized graph library. Your new graph will be displayed in ‘My Graphs’ page.
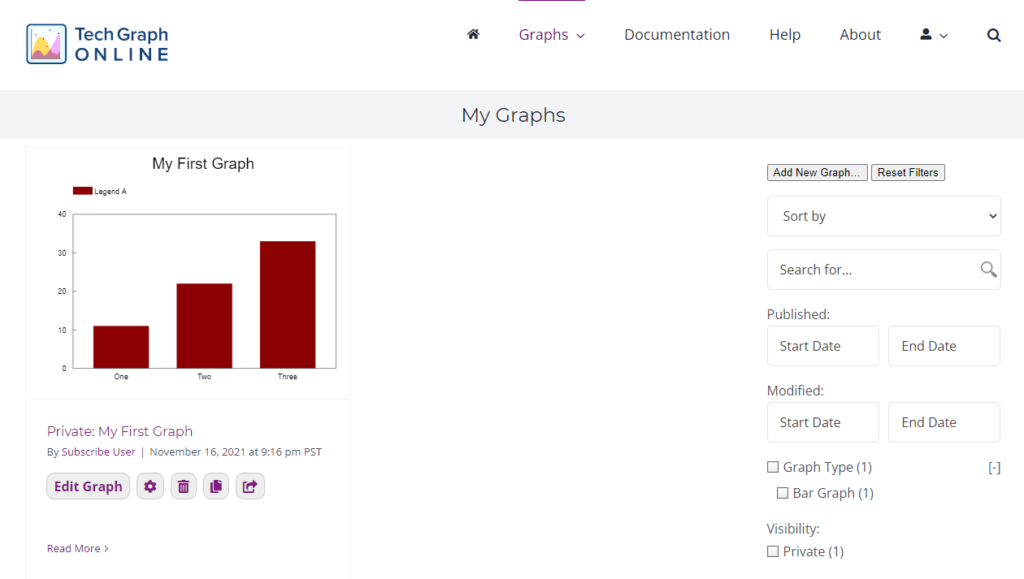
The graph name (“Private: My First Graph), author (“Subscribe User”), creation date and time, and a group of Action ![]() buttons are displayed below each graph.
buttons are displayed below each graph.
The Edit Graph ![]() button activates the TechGraph Editor. The data and chart settings of the selected graph are sent to the TechGraph Editor so you can make changes to the data and chart settings. You can also print and generate graphics bitmap files for publishing.
button activates the TechGraph Editor. The data and chart settings of the selected graph are sent to the TechGraph Editor so you can make changes to the data and chart settings. You can also print and generate graphics bitmap files for publishing.
The Properties![]() button opens the Properties Editor so you can update the Name, Notes and Visibility status. The Name tab will allow you to set the Graph Name. The Notes tab will let you add notes about the graph.
button opens the Properties Editor so you can update the Name, Notes and Visibility status. The Name tab will allow you to set the Graph Name. The Notes tab will let you add notes about the graph.
The Name and Notes fields are searchable on the website. You can add keywords or phrases to these fields to make the graph or sets of graphs easier to find. For example, to group a set of 10 graphs, enter a keyword phrase such as “XYZ Project” as part of the Name field for each graph. Entering “XYZ Project” as a keyword in the search field will identify and display all 10 graphs in the ‘My Graphs’ page.
The Visibility tab will let you change the visibility setting. The default visibility setting is Private. Select Public or Password Protected to allow others to view your graph without or with a password, respectively.
The Delete ![]() button removes the graph from your ‘My Graphs’ library.
button removes the graph from your ‘My Graphs’ library.
The Clone ![]() button creates another copy of the graph in your ‘My Graphs’ library.
button creates another copy of the graph in your ‘My Graphs’ library.
The Share ![]() button allows one to share the graph to others by copying the URL link to the clipboard, email, Facebook, Twitter, and WhatsApp.
button allows one to share the graph to others by copying the URL link to the clipboard, email, Facebook, Twitter, and WhatsApp.